普罗米修斯
Prometheus是一种开源的监控系统,最初由SoundCloud开发并于2012年发布。它是一种基于指标的监控系统,能够收集、存储和查询来自各种应用程序、服务和系统的度量数据。这些度量数据可以表示应用程序和系统的性能、健康状况和状态等信息。
Prometheus已经成为了云原生中指标监控的事实标准。它提供了一个灵活的数据模型和查询语言,支持多维度度量数据的聚合和图形化展示,使得开发人员和系统管理员能够快速地诊断和解决问题。此外,Prometheus还提供了一系列的工具和库,使得它可以轻松地与其他系统和服务集成。
监控架构推进
第一版本:Cadvisor+InfluxDB+Grafana

只能从主机维度进行采集,没有Namespace、Pod等维度的汇聚功能
因为它们仅仅是在主机维度上进行数据采集、存储和展示。
是用于早期的docker监控方案。
具体来说,Cadvisor是一个基于容器的性能监控工具,主要用于收集和展示Docker容器的性能数据,包括CPU、内存、网络和文件系统等方面的指标。而InfluxDB是一种高性能、分布式的时序数据库,可以用于存储和查询时序数据,例如Cadvisor采集的容器指标数据。Grafana则是一种开源的可视化工具,可以连接到InfluxDB中存储的数据,并生成各种形式的图表和仪表盘。
虽然这个组合非常简单易用,但它确实无法对容器的Namespace、Pod等维度进行汇聚功能,这对于在Kubernetes等容器编排平台上部署的应用程序来说可能是一个缺点。为了解决这个问题,需要使用支持容器编排平台的监控系统,例如Prometheus、Sysdig等。这些系统可以在容器编排平台的控制面板中提供更多的汇聚功能和维度支持,以便更好地监控和管理容器化应用程序。
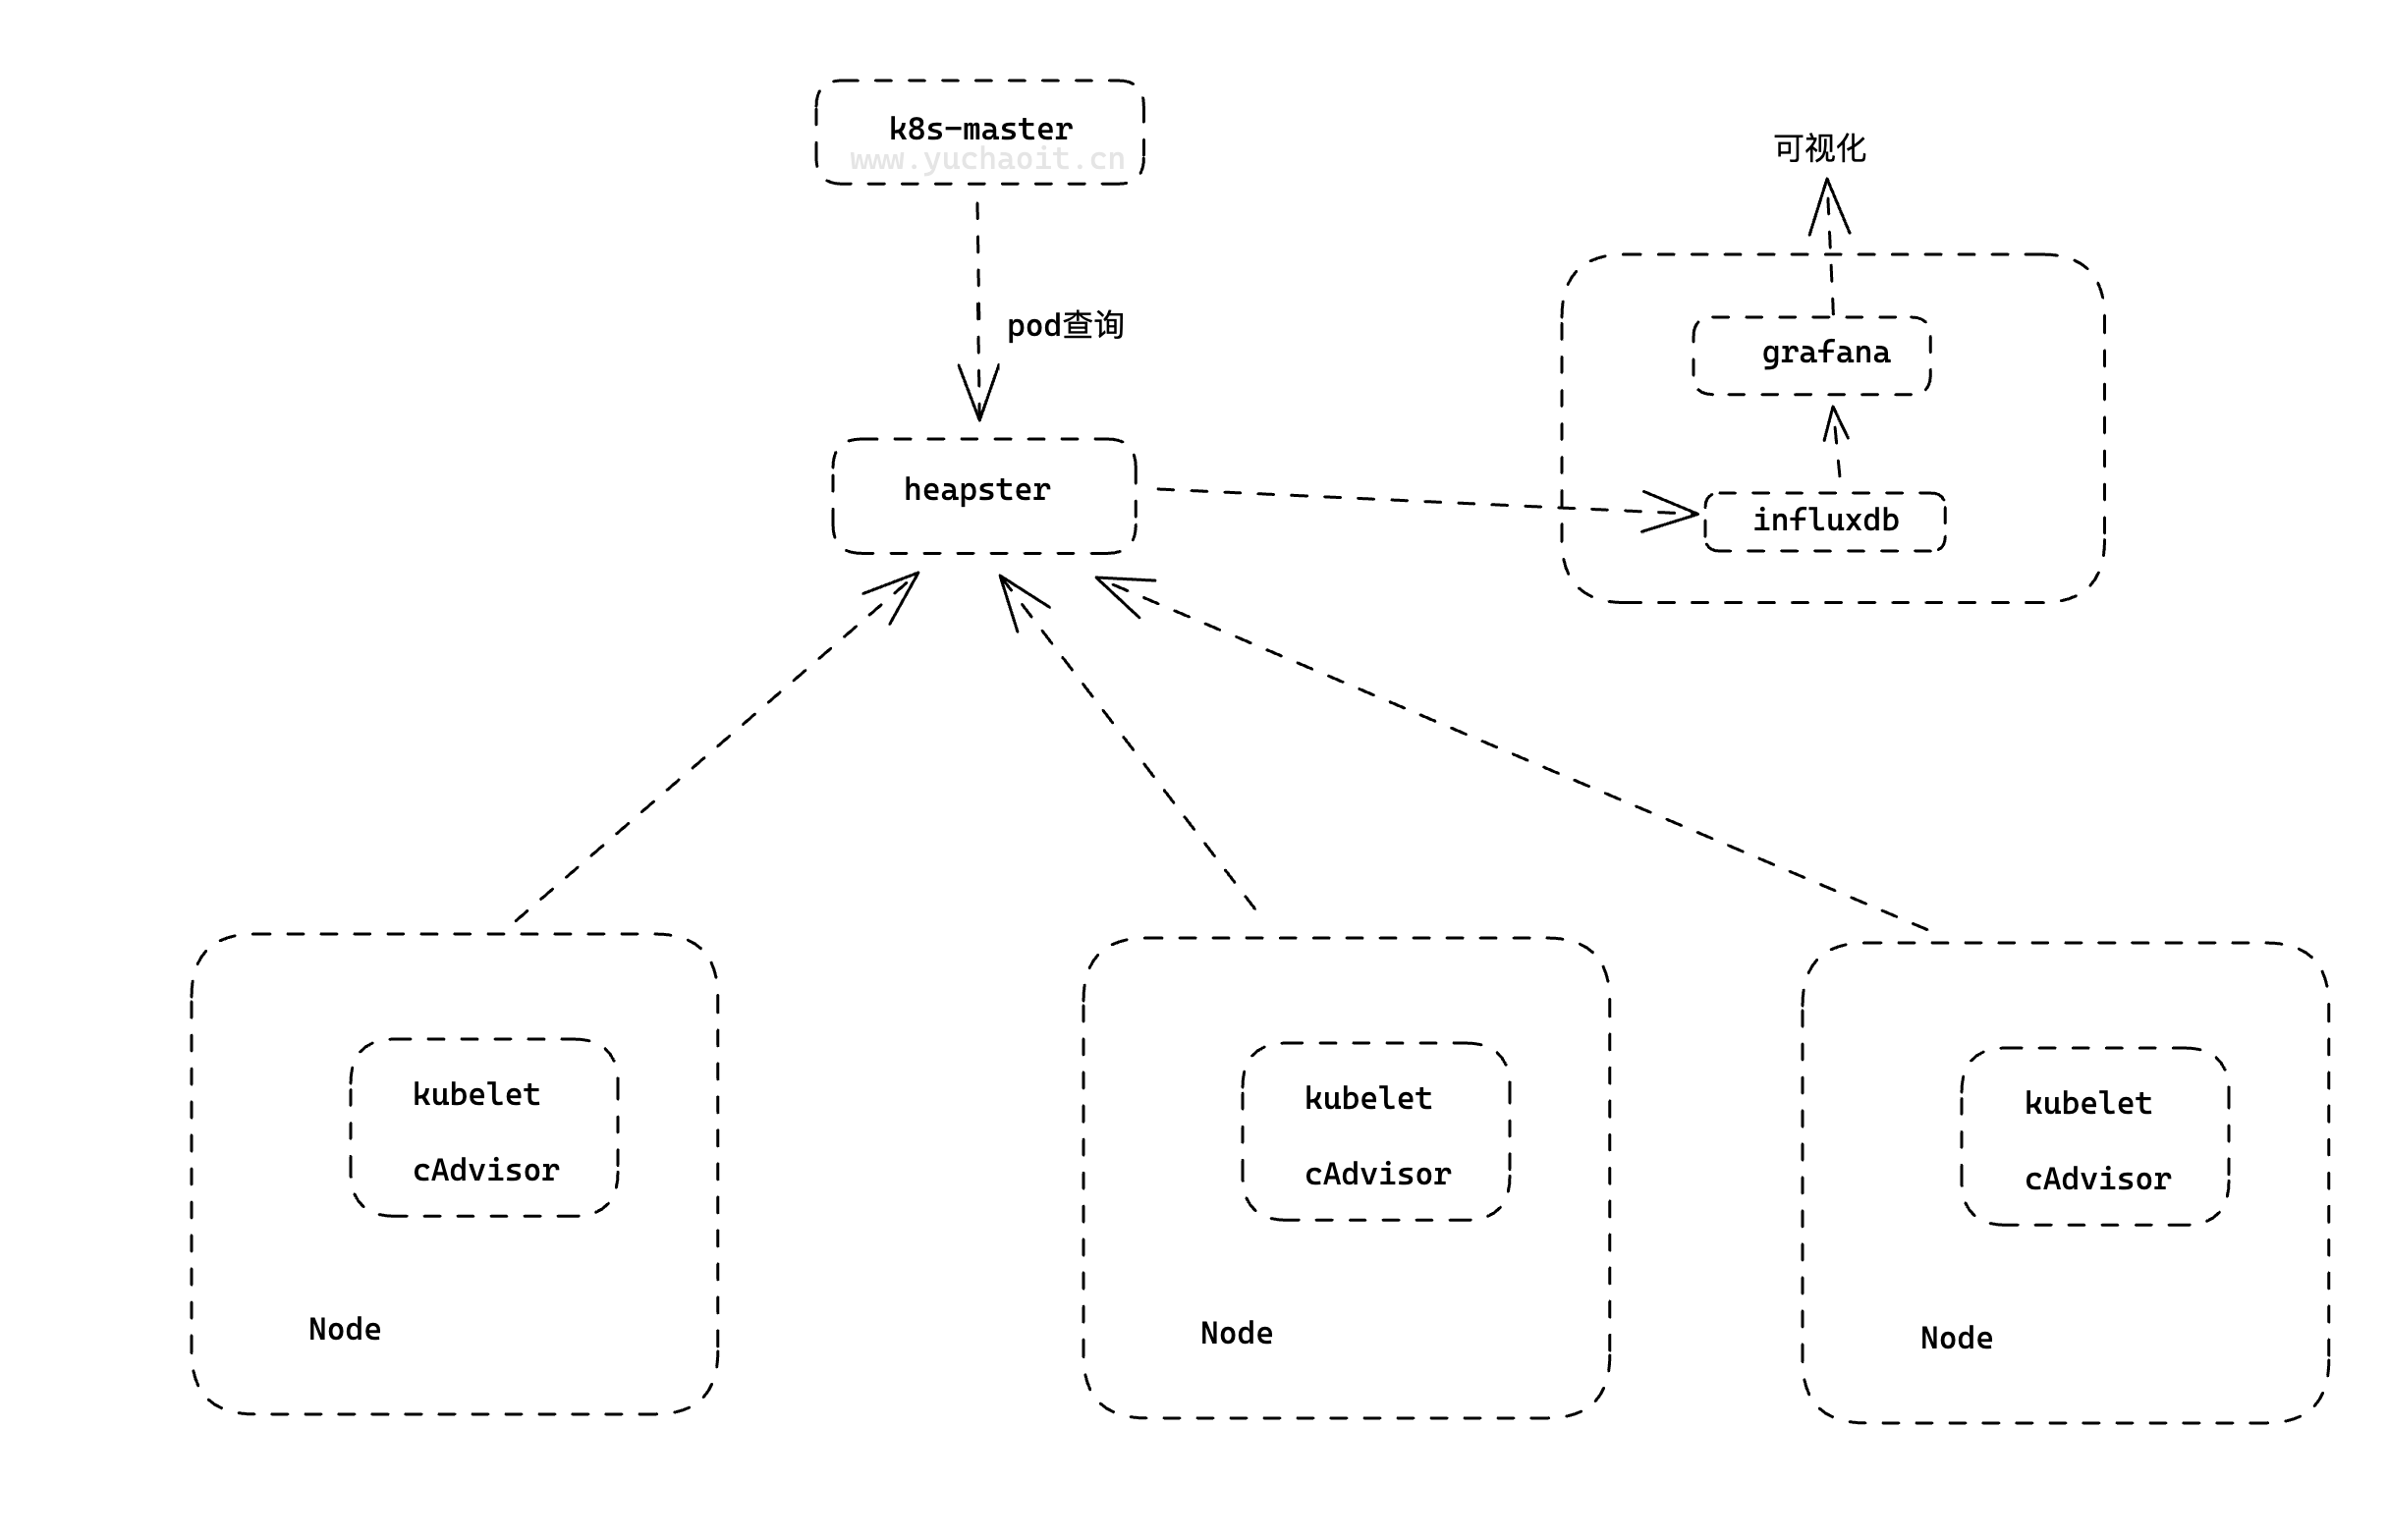
第二版本: Heapster+InfluxDB+Grafana
heapster负责调用各node中的cadvisor接口,对数据进行汇总,然后导到InfluxDB , 可以从cluster,node,pod的各个层面提供详细的资源使用情况。
Heapster是一个基于Kubernetes的集群监控系统,主要用于收集和展示Kubernetes集群中各个节点和容器的资源使用情况,包括CPU、内存、网络和磁盘等方面的指标。Heapster会调用各个节点上的Cadvisor接口,对数据进行汇总,并将其导入到InfluxDB中进行存储。通过Heapster,我们可以从集群、节点和Pod等多个维度了解资源的使用情况,以便更好地管理和调整集群的资源。
InfluxDB和Grafana的作用与第一版本监控系统组合相同,InfluxDB用于存储时序数据,Grafana用于可视化展示监控指标数据。使用Heapster+InfluxDB+Grafana组合,我们可以在Kubernetes集群中实现更细粒度的监控和资源管理,以便更好地保障应用程序的稳定和高可用性。
第三版本:Metrics-Server + Prometheus
第三个版本的监控系统组合是Metrics-Server+Prometheus,该组合是在Kubernetes集群中实现监控和度量指标的最佳方式之一。
Metrics-Server是一个轻量级的Kubernetes集群监控工具,主要用于收集和存储集群和节点的度量指标数据,例如CPU和内存的使用情况。它是Kubernetes的一个官方组件,可以提供与Kubernetes API Server的集成,支持通过Kubernetes API访问集群的度量指标数据。
而Prometheus是一种开源的指标监控系统,也是云原生中的事实标准,具有高可用性、可扩展性和灵活性等优点。Prometheus可以通过集成Kubernetes API Server,自动发现和采集Kubernetes集群中的各种度量指标数据,包括容器、Pod、节点和服务等各种资源的指标数据。同时,Prometheus还提供了灵活的查询语言和展示方式,可以轻松地生成各种类型的图表和报表。
通过Metrics-Server+Prometheus组合,我们可以在Kubernetes集群中实现更全面和细粒度的监控和度量指标收集,同时还能够实现自动化的指标数据采集和展示。这将有助于更好地理解和管理Kubernetes集群中的各种资源,优化应用程序的性能和可靠性。

1.Prometheus架构
不用做选择纠结,唯一实施标准就是云原生监控,普罗米修斯。
k8s对监控接口进行了标准化,主要分了三类:
Resource Metrics
metric-api对应的接口是 metrics.k8s.io,主要的实现就是 metrics-server,它提供的是资源的监控,比较常见的是节点级别、pod 级别、namespace 级别、class 级别。这类的监控指标都可以通过 metrics.k8s.io 这个接口获取到
Custom Metrics
对应的接口是 custom.metrics.k8s.io,主要的实现是 Prometheus, 它提供的是资源监控和自定义监控,资源监控和上面的资源监控其实是有覆盖关系的。
自定义监控指的是:比如应用上面想暴露一个类似像在线人数,或者说调用后面的这个数据库的 MySQL 的慢查询。这些其实都是可以在应用层做自己的定义的,然后并通过标准的 Prometheus 的 client,暴露出相应的 metrics,然后再被 Prometheus 进行采集
External Metrics
对应的接口是 external.metrics.k8s.io。主要的实现厂商就是各个云厂商的 provider,通过这个 provider 可以通过云资源的监控指标
简单理解为zabbix的监控项就行了。
和zabbix的监控项类似,Kubernetes的监控接口也提供了一系列标准化的指标,用于监控和度量应用程序和基础设施的性能。
不同的是,Kubernetes的监控接口是基于API接口进行实现的,提供了三种不同的接口类型,可以满足不同层次、不同类型的监控需求,包括基础设施层面的资源监控、应用层面的自定义监控以及云资源层面的监控等。
同时,Kubernetes的监控标准化也更加贴合容器化的场景,能够更好地适应云原生技术的发展趋势。
架构图

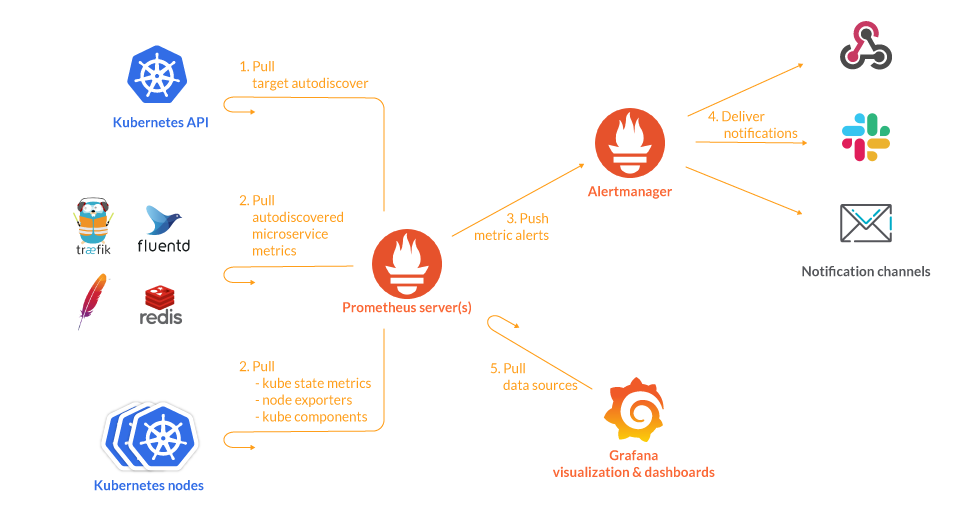
Prometheus是一种开源的监控和告警系统,其核心是Prometheus Server。以下是Prometheus的组件工作流程:
- Exporter:Exporter是被监控的对象提供的一种组件,通过API暴露监控对象的指标,供Prometheus Server抓取。Exporter可以是预定义的也可以是自定义的。
- Prometheus Server:Prometheus Server是监控和告警平台的核心。它通过定期从Exporter抓取指标数据来生成聚合数据,并将其存储在时间序列数据库中。
- Pushgateway:Pushgateway提供一个网关地址,外部数据可以推送到该网关,Prometheus Server也会从该网关拉取数据。这使得非直接可抓取的指标也能够被Prometheus Server监控。
- Alertmanager:Alertmanager接收Prometheus Server发送的告警,并对于告警进行一系列的处理后发送给指定的目标。Alertmanager提供了灵活的告警处理方式,可以通过配置路由树和模板来定制告警的处理方式。
- Grafana:Grafana是一个用于数据可视化的开源平台。在Grafana中,可以配置Prometheus Server作为数据源,从而实现对时间序列数据的查询和展示。Grafana还支持自定义的面板和警报,并提供了灵活的布局和样式选项。
总之,Prometheus Server通过抓取Exporter提供的监控指标,生成聚合数据,并存储在时间序列数据库中,同时通过Alertmanager对指定的告警进行处理和发送。在Grafana中,可以将Prometheus Server作为数据源,通过灵活的面板和警报定制对时间序列数据的可视化展示。
组件工作流
当Prometheus启动时,它会从配置文件中读取要监控的目标(通过job的定义),并根据其中定义的抓取间隔和超时时间,定期向目标端发起请求,获取该目标的监控指标数据。这些指标数据通过HTTP或者其他协议(如SNMP等)提供,而不是直接暴露在Prometheus上。这个目标可以是机器、容器、服务等,只要目标暴露了符合Prometheus格式要求的指标,就可以被Prometheus监控到。
在目标上,可以安装一些Exporter,用于将该目标特定的指标格式转换为Prometheus能够理解的格式。例如,Node Exporter是用于监控主机的Exporter,它会暴露出CPU使用率、内存使用率、磁盘空间使用率等指标。Blackbox Exporter则是用于监控网络设备、Web服务等的Exporter,它会暴露出ping延迟、HTTP请求延迟等指标。
Prometheus Server会将抓取到的数据存储为时间序列数据,并进行指标聚合和计算。聚合的过程通常涉及函数式查询和数据处理,例如计算平均值、求和等。Prometheus使用其内部的时间序列数据库存储这些数据,这使得Prometheus可以快速执行复杂的查询。
Prometheus可以通过Pushgateway组件接收来自外部的指标数据,例如batch任务或者短生命周期的任务。Pushgateway允许这些任务向Prometheus推送数据而不必暴露一个API供Prometheus拉取数据。
最后,当Prometheus检测到某些监控指标超过阈值或发生异常时,会将告警信息发送给Alertmanager。Alertmanager可以根据预定义的规则和策略,对告警进行聚合、去重、降噪等操作,最终将告警发送到配置的目标,例如邮件、Slack、PagerDuty等。
除此之外,Grafana是常用的可视化工具,它可以与Prometheus集成,用于展示Prometheus的监控数据和告警信息。Grafana提供了灵活的仪表盘设计和配置功能,可以帮助用户更好地理解监控数据。
使用过程
当你要监控某个服务的时候,你需要完成以下步骤:
服务暴露metrics
Prometheus采集指标是通过HTTP协议获取的。因此,服务需要在HTTP协议上暴露metrics,即为exporter提供API。Prometheus提供了client libraries来帮助应用程序曝光指标。
配置监控
为了配置Prometheus实例以了解哪些目标需要监视,需要编写一个具有指标的配置文件。
Prometheus Server采集数据
Prometheus Server定期拉取exporter暴露的metrics,如果抓取失败,将会发送警报。
数据存储
Prometheus Server将所有数据存储在本地磁盘上的时序数据库中。
查询与可视化
Prometheus提供了PromQL查询语言和Grafana可视化平台,可查询和展示存储在时序数据库中的监控数据。
告警与通知
Prometheus的告警管理器(Alertmanager)可以帮助你处理警报,包括分类、去重和通知。告警规则可以在Prometheus配置文件中定义,然后在Alertmanager中进行配置,例如发送邮件、Slack消息、Webhooks等。
2.安装Prometheus
docker部署
基于go开发, https://github.com/prometheus/prometheus
若使用docker部署直接启动镜像即可:
$ docker run --name prometheus -d -p 127.0.0.1:9090:9090 prom/prometheus:v2.28.0
我们想制作Prometheus的yaml文件,可以先启动容器进去看一下默认的启动命令:
[root@docker01 ~]#docker exec -it prometheus sh
/prometheus $ ps -ef
PID   USER     TIME  COMMAND
    1 nobody    0:00 /bin/prometheus --config.file=/etc/prometheus/prometheus.yml --storage.tsdb.path=/prometheus --web.console.libraries=/usr/sh
   20 nobody    0:00 sh
   26 nobody    0:00 ps -ef
/prometheus $ cat /etc/prometheus/prometheus.yml
# my global config
global:
  scrape_interval:     15s # Set the scrape interval to every 15 seconds. Default is every 1 minute.
  evaluation_interval: 15s # Evaluate rules every 15 seconds. The default is every 1 minute.
  # scrape_timeout is set to the global default (10s).

# Alertmanager configuration
alerting:
  alertmanagers:
  - static_configs:
    - targets:
      # - alertmanager:9093

# Load rules once and periodically evaluate them according to the global 'evaluation_interval'.
rule_files:
  # - "first_rules.yml"
  # - "second_rules.yml"

# A scrape configuration containing exactly one endpoint to scrape:
# Here it's Prometheus itself.
scrape_configs:
  # The job name is added as a label `job=<job_name>` to any timeseries scraped from this config.
  - job_name: 'prometheus'

    # metrics_path defaults to '/metrics'
    # scheme defaults to 'http'.

    static_configs:
    - targets: ['localhost:9090']
用k8s部署
configmap挂载配置文件
# 需要准备配置文件,因此使用configmap的形式保存
$ cat prometheus.yml
# 用上面docker查出来的配置即可
[root@k8s-master ~/prometheus-all]#kubectl create ns monitor
namespace/monitor created
[root@k8s-master ~/prometheus-all]#
[root@k8s-master ~/prometheus-all]#kubectl -n monitor create configmap prometheus-config --from-file=prometheus.yml
configmap/prometheus-config created
[root@k8s-master ~/prometheus-all]#kubectl -n monitor get cm
NAME                DATA   AGE
kube-root-ca.crt    1      5s
prometheus-config   1      4s
pvc持久化
kind: PersistentVolumeClaim
apiVersion: v1
metadata:
  name: prometheus
  namespace: monitor
spec:
  accessModes:
    - ReadWriteOnce
  storageClassName: nfs
  resources:
    requests:
      storage: 200Gi
应用部署deployment
# prometheus的资源文件
# 出现Prometheus数据存储权限问题,因为Prometheus内部使用nobody启动进程,挂载数据目录后权限为root,因此使用initContainer进行目录权限修复:
$ cat prometheus-deployment.yaml
apiVersion: apps/v1
kind: Deployment
metadata:
  name: prometheus
  namespace: monitor
  labels:
    app: prometheus
spec:
  selector:
    matchLabels:
      app: prometheus
  template:
    metadata:
      labels:
        app: prometheus
    spec:
      serviceAccountName: prometheus # 容器绑定sa账户,也要访问k8sAPI
      initContainers:
      - name: "change-permission-of-directory"
        image: busybox
        command: ["/bin/sh"]
        args: ["-c", "chown -R 65534:65534 /prometheus"] # 普罗米修斯的启动用户65534
        securityContext:
          privileged: true
        volumeMounts:
        - mountPath: "/etc/prometheus"
          name: config-volume
        - mountPath: "/prometheus"
          name: data
      containers:
      - image: prom/prometheus:v2.28.0
        name: prometheus
        args:
        - "--config.file=/etc/prometheus/prometheus.yml"
        - "--storage.tsdb.path=/prometheus"  # 指定tsdb数据路径
        - "--web.enable-lifecycle"  # 支持热更新,直接执行localhost:9090/-/reload立即生效
        - "--web.console.libraries=/usr/share/prometheus/console_libraries"
        - "--web.console.templates=/usr/share/prometheus/consoles"
        ports:
        - containerPort: 9090
          name: http
        volumeMounts:
        - mountPath: "/etc/prometheus"
          name: config-volume
        - mountPath: "/prometheus"
          name: data
        resources:
          requests:
            cpu: 100m
            memory: 512Mi
          limits:
            cpu: 100m
            memory: 512Mi
      volumes:
      - name: data
        persistentVolumeClaim:
          claimName: prometheus
      - configMap:
          name: prometheus-config
        name: config-volume
RBAC
只要你自己创建的资源,要去访问k8s API,例如像kubectl一样去查询数据,就得有认证、鉴权。
# rbac,prometheus会调用k8s api做服务发现进行抓取指标
$ cat prometheus-rbac.yaml
apiVersion: v1
kind: ServiceAccount
metadata:
  name: prometheus
  namespace: monitor
---
apiVersion: rbac.authorization.k8s.io/v1
kind: ClusterRole
metadata:
  name: prometheus
rules:
- apiGroups:
  - ""
  resources:
  - nodes
  - services
  - endpoints
  - pods
  - nodes/proxy
  verbs:
  - get
  - list
  - watch
- apiGroups:
  - "extensions"
  resources:
    - ingresses
  verbs:
  - get
  - list
  - watch
- apiGroups:
  - ""
  resources:
  - configmaps
  - nodes/metrics
  verbs:
  - get
- nonResourceURLs:
  - /metrics
  verbs:
  - get
---
apiVersion: rbac.authorization.k8s.io/v1
kind: ClusterRoleBinding
metadata:
  name: prometheus
roleRef:
  apiGroup: rbac.authorization.k8s.io
  kind: ClusterRole
  name: prometheus
subjects:
- kind: ServiceAccount
  name: prometheus
  namespace: monitor
service
对deployment进行负载均衡,且提供给ingress做发布
# 提供Service,为Ingress使用
$ cat prometheus-svc.yaml
apiVersion: v1
kind: Service
metadata:
  name: prometheus
  namespace: monitor
  labels:
    app: prometheus
spec:
  selector:
    app: prometheus
  type: ClusterIP
  ports:
    - name: web
      port: 9090
      targetPort: http
ingress
$ cat prometheus-ingress.yaml
apiVersion: networking.k8s.io/v1
kind: Ingress
metadata:
  name: prometheus
  namespace: monitor
spec:
  ingressClassName: nginx
  rules:
  - host: prometheus.yuchaoit.cn
    http:
      paths:
      - path: /
        pathType: Prefix
        backend:
          service:
            name: prometheus
            port:
              number: 9090
创建所有资源
[root@k8s-master ~/prometheus-all]#kubectl apply -f .

[root@k8s-master ~/prometheus-all]#kubectl -n monitor get pvc
NAME         STATUS   VOLUME                                     CAPACITY   ACCESS MODES   STORAGECLASS   AGE
prometheus   Bound    pvc-c6a83e3f-efd9-47c6-b527-ea34bc2849b9   200Gi      RWO            nfs            6m7s

[root@k8s-master ~/prometheus-all]#kubectl -n monitor get ingress
NAME         CLASS   HOSTS                    ADDRESS   PORTS   AGE
prometheus   nginx   prometheus.yuchaoit.cn             80      6m28s


[root@k8s-master ~/prometheus-all]#kubectl -n monitor get all
NAME                             READY   STATUS    RESTARTS   AGE
pod/prometheus-6c8768547-tlrbf   1/1     Running   0          6m14s

NAME                 TYPE        CLUSTER-IP   EXTERNAL-IP   PORT(S)    AGE
service/prometheus   ClusterIP   10.97.9.15   <none>        9090/TCP   6m14s

NAME                         READY   UP-TO-DATE   AVAILABLE   AGE
deployment.apps/prometheus   1/1     1            1           6m14s

NAME                                   DESIRED   CURRENT   READY   AGE
replicaset.apps/prometheus-6c8768547   1         1         1       6m14s
访问测试
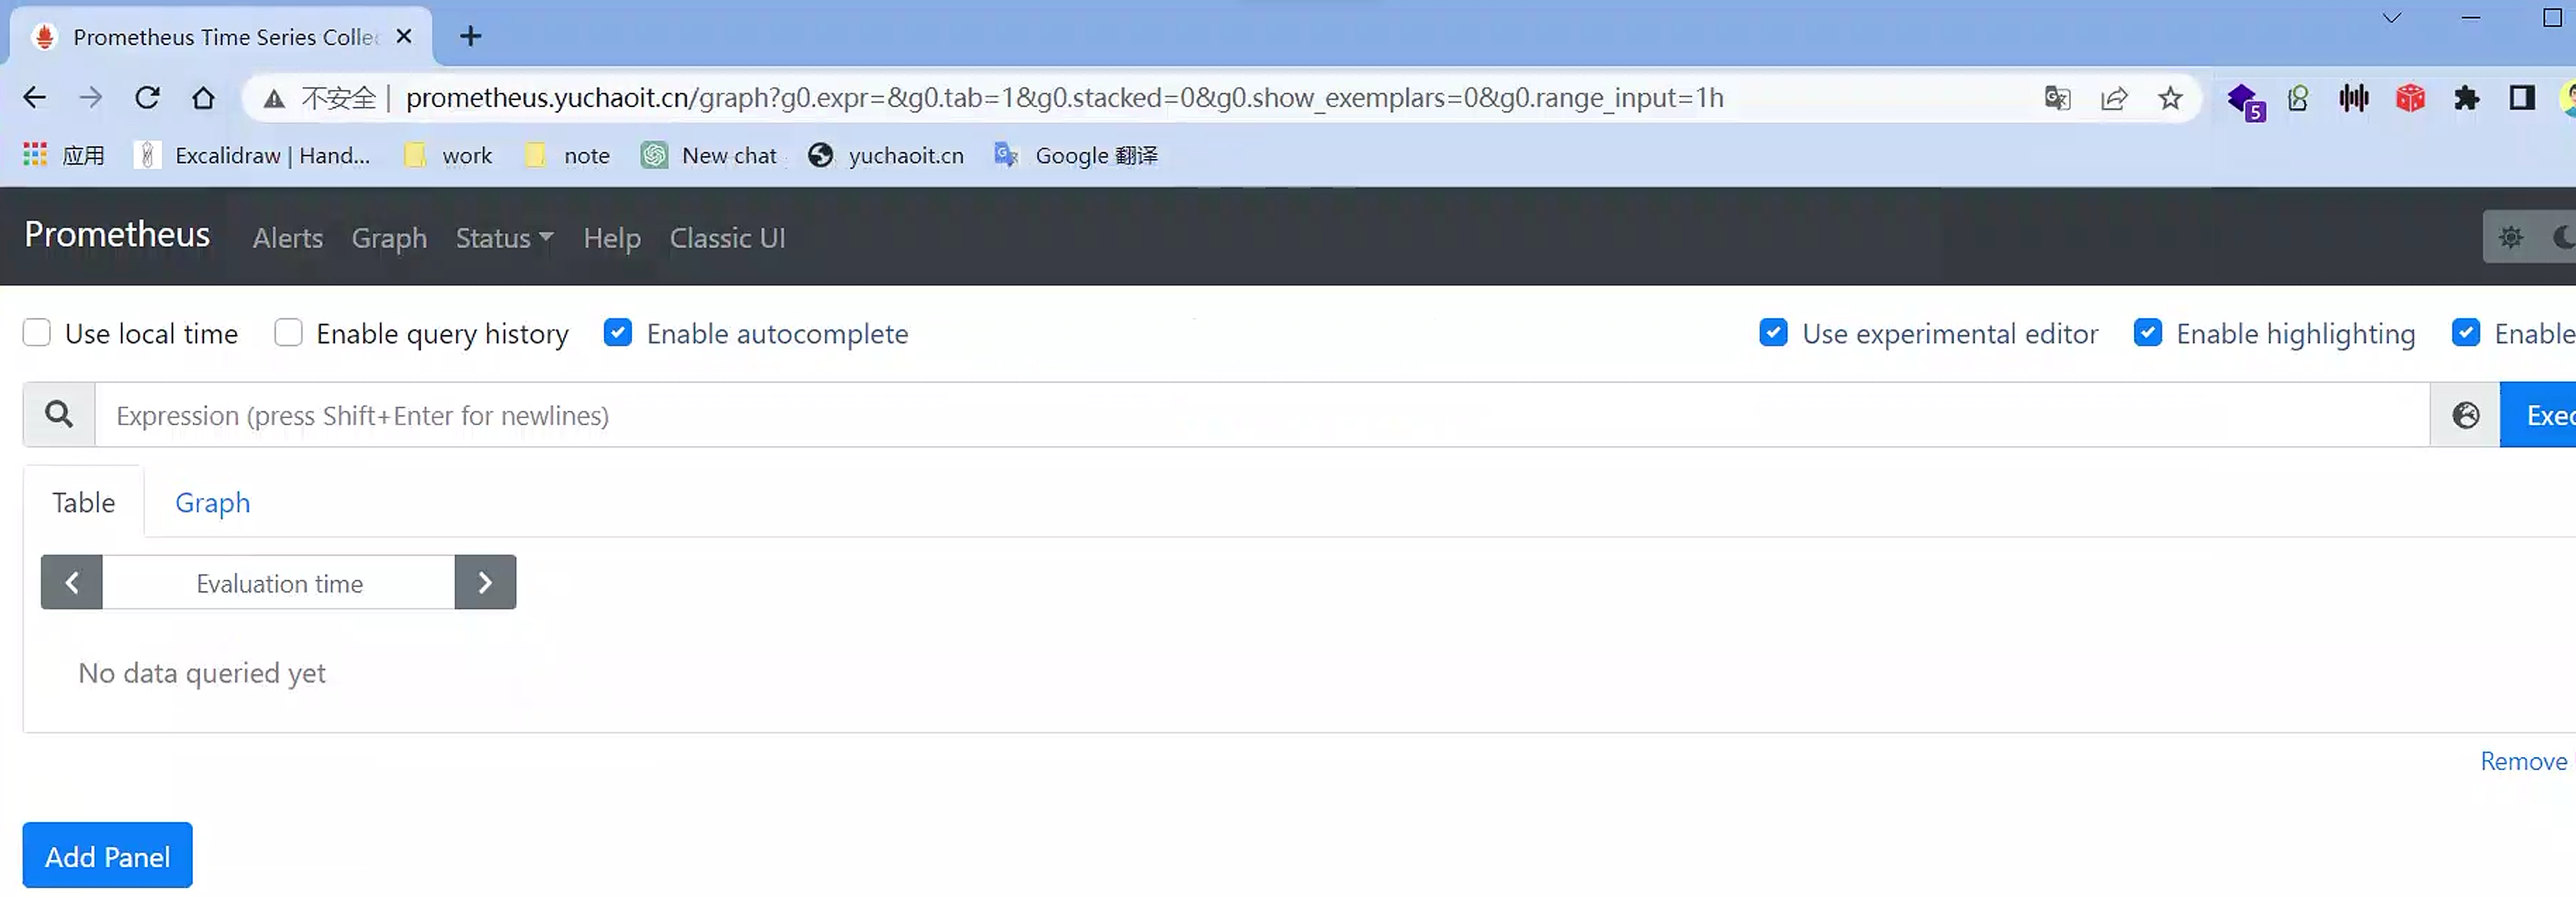
日志、接口查看
[root@k8s-master ~/prometheus-all]#kubectl -n monitor logs -f prometheus-6c8768547-v7hqq --tail=5
Defaulted container "prometheus" out of: prometheus, change-permission-of-directory (init)
level=warn ts=2023-04-28T07:12:55.302Z caller=main.go:832 fs_type=NFS_SUPER_MAGIC msg="This filesystem is not supported and may lead to data corruption and data loss. Please carefully read https://prometheus.io/docs/prometheus/latest/storage/ to learn more about supported filesystems."
level=info ts=2023-04-28T07:12:55.302Z caller=main.go:837 msg="TSDB started"
level=info ts=2023-04-28T07:12:55.302Z caller=main.go:964 msg="Loading configuration file" filename=/etc/prometheus/prometheus.yml
level=info ts=2023-04-28T07:12:55.393Z caller=main.go:995 msg="Completed loading of configuration file" filename=/etc/prometheus/prometheus.yml totalDuration=91.303564ms remote_storage=4.377µs web_handler=537ns query_engine=1.292µs scrape=91.068877ms scrape_sd=42.964µs notify=19.369µs notify_sd=6.329µs rules=1.847µs
level=info ts=2023-04-28T07:12:55.393Z caller=main.go:779 msg="Server is ready to receive web requests."


# ingress-nginx也正常
[root@k8s-master ~/prometheus-all]#kubectl -n ingress-nginx logs ingress-nginx-controller-5cf5b685c5-wrk7w  -f --tail=2
10.0.0.1 - - [28/Apr/2023:07:20:22 +0000] "GET /api/v1/label/__name__/values HTTP/1.1" 200 1480 "http://prometheus.yuchaoit.cn/graph?g0.expr=&g0.tab=1&g0.stacked=0&g0.show_exemplars=0&g0.range_input=1h" "Mozilla/5.0 (Windows NT 10.0; Win64; x64) AppleWebKit/537.36 (KHTML, like Gecko) Chrome/111.0.0.0 Safari/537.36" 418 0.019 [monitor-prometheus-9090] [] 10.244.1.96:9090 1480 0.019 200 295f430d112b0cffe4e39eb4c80d9136
10.0.0.1 - - [28/Apr/2023:07:20:24 +0000] "GET /api/v1/targets?state=active HTTP/1.1" 200 301 "http://prometheus.yuchaoit.cn/targets" "Mozilla/5.0 (Windows NT 10.0; Win64; x64) AppleWebKit/537.36 (KHTML, like Gecko) Chrome/111.0.0.0 Safari/537.36" 350 0.002 [monitor-prometheus-9090] [] 10.244.1.96:9090 301 0.002 200 846459b16f88698a264666272286c2dd
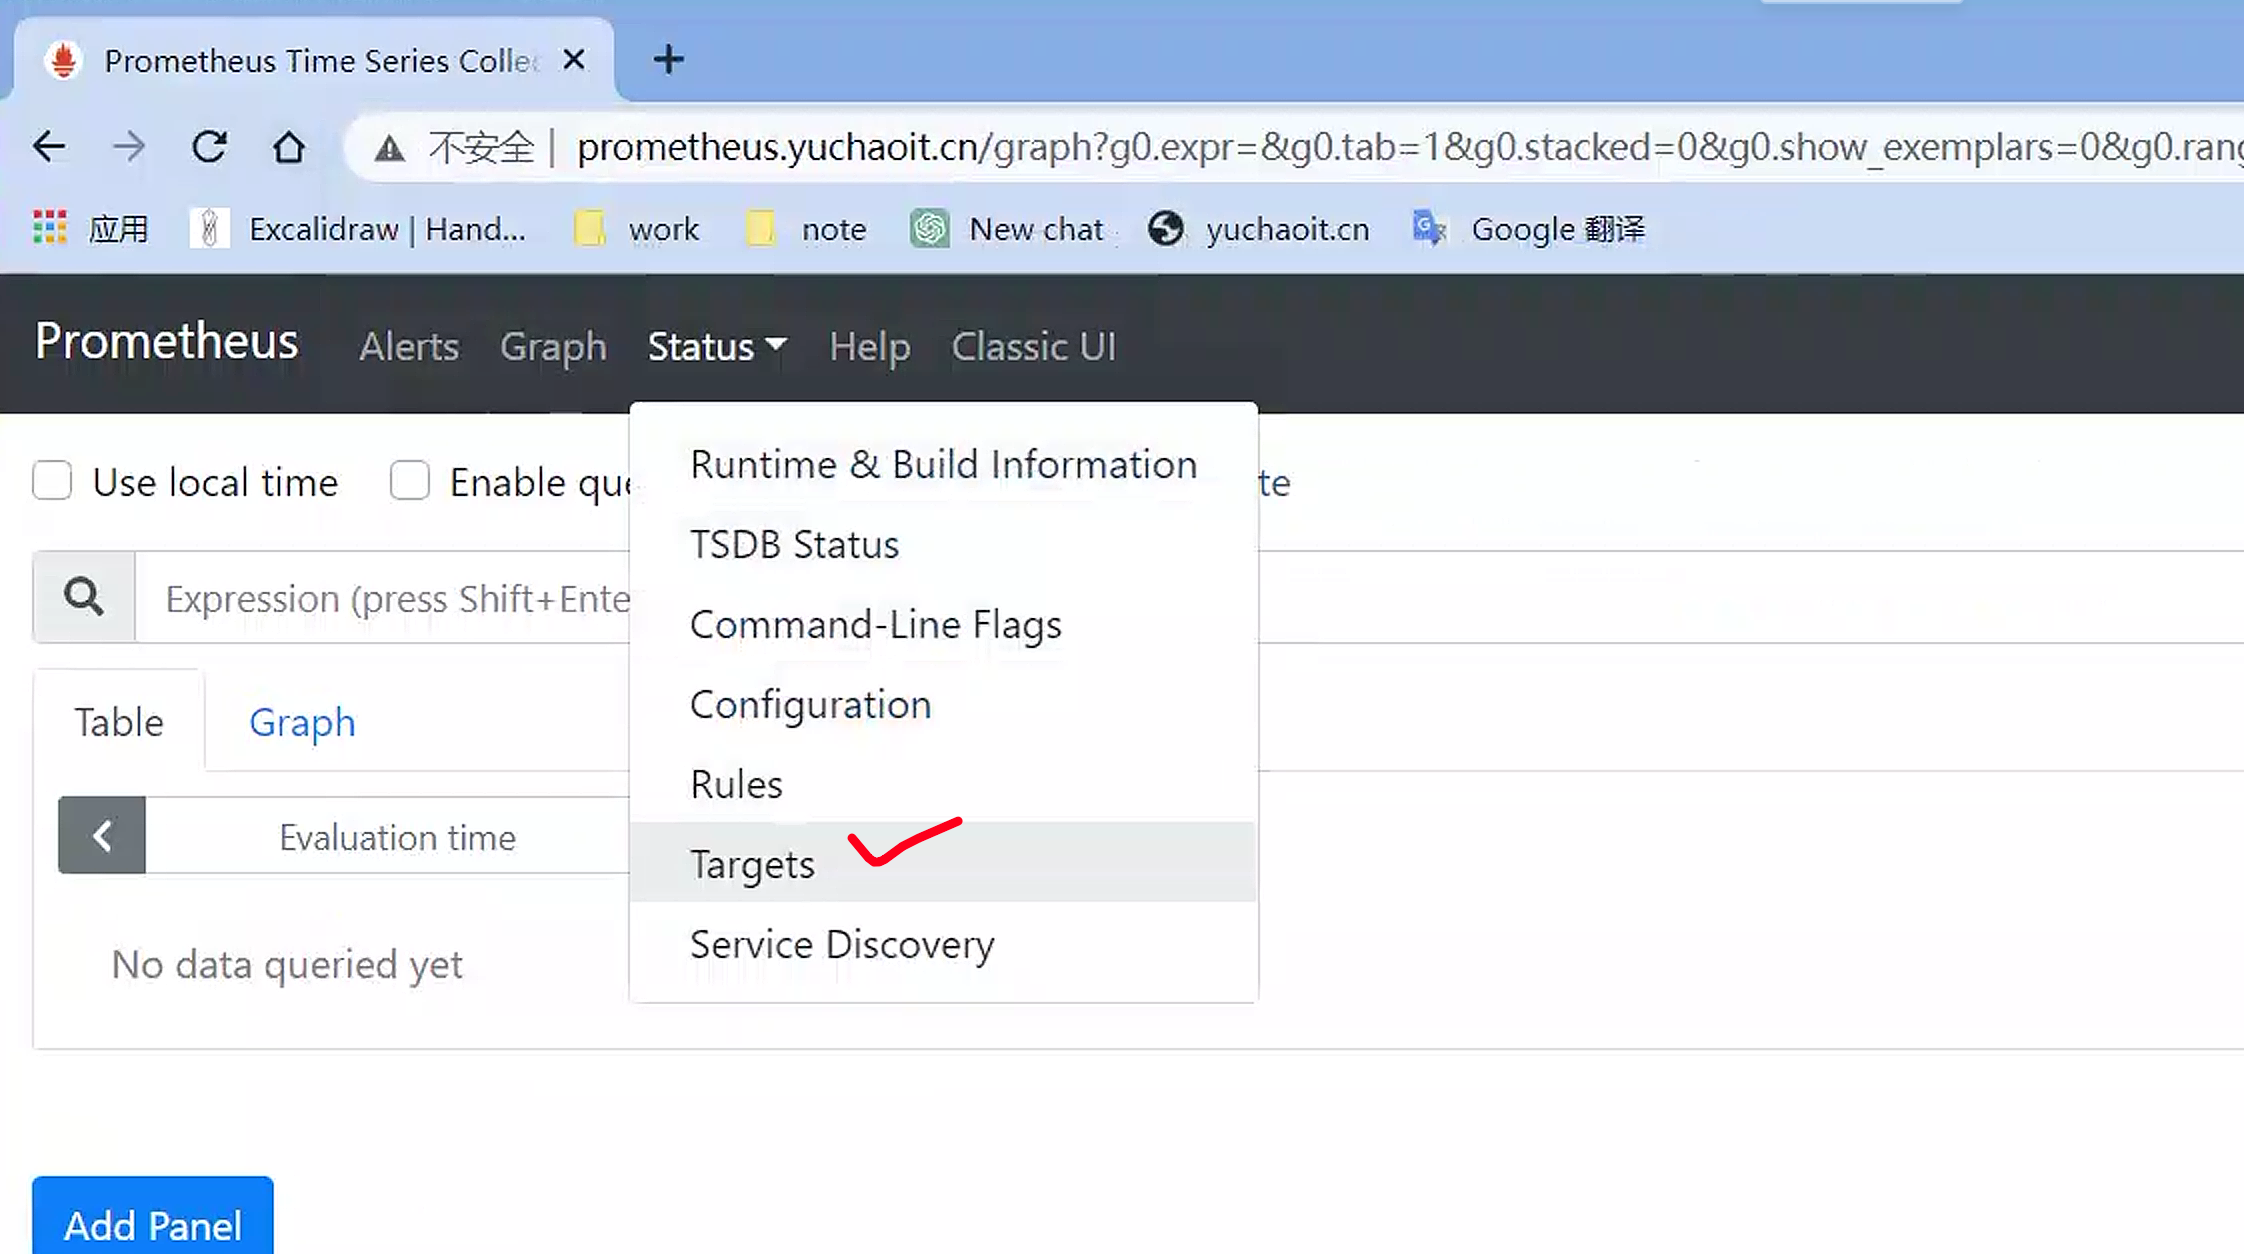
targets
Prometheus是一个监控系统,用于收集和存储指标数据。在Prometheus中,"Targets"表示要监控的目标对象,可以是一个服务器、一个进程、一个容器等等。Targets是由用户在Prometheus配置文件中定义的,它们指定了应该从哪个地址、端口、路径等地方获取指标数据。
当Prometheus开始工作时,它会定期从定义的Targets中拉取指标数据,这些数据包含有关目标对象的有用信息,例如CPU使用率、内存使用率、网络流量等。Prometheus会将这些指标数据存储在本地,并使用这些数据生成有用的监控报告和警报。
在Prometheus的Web界面中,可以通过"Targets"选项卡查看所有已定义的Targets。您可以通过查看Targets的状态和指标数据来了解目标对象的性能和健康状况,从而确定是否需要采取措施来改善或优化目标对象的运行状态。
scrape_configs:
  # The job name is added as a label `job=<job_name>` to any timeseries scraped from this config.
  - job_name: 'prometheus'

    # metrics_path defaults to '/metrics'
    # scheme defaults to 'http'.

    static_configs:
    - targets: ['localhost:9090'] # 默认去拉取哪些数据,在这里写
[root@k8s-master ~/prometheus-all]#cat prometheus.yml

# 这个localhost是指prometheus的本地pod地址
# 直接访问普罗米修斯pod端口
[root@k8s-master ~/prometheus-all]#curl -s  10.244.1.96:9090/metrics |wc -l
817
这段配置的作用是告诉Prometheus监控本地主机上的9090端口,也就是在该主机上运行的Prometheus实例。具体来说,这段配置是属于"prometheus"作业的静态配置,它定义了一个单一的目标(target)来收集该作业的指标数据。在Prometheus中,一个目标可以是一个URL或者是一个端点(endpoint),它可以是一个单独的服务、一个集群或者是一组服务。
抓取时间
[root@k8s-master ~/prometheus-all]#cat prometheus.yml
global:
  scrape_interval:     15s # Set the scrape interval to every 15 seconds. Default is every 1 minute.
  evaluation_interval: 15s # Evaluate rules every 15 seconds. The default is every 1 minute.
  # scrape_timeout is set to the global default (10s).
每次拿到的数据
[root@k8s-master ~/prometheus-all]#curl -s  10.244.1.96:9090/metrics |tail
# TYPE prometheus_web_federation_warnings_total counter
prometheus_web_federation_warnings_total 0
# HELP promhttp_metric_handler_requests_in_flight Current number of scrapes being served.
# TYPE promhttp_metric_handler_requests_in_flight gauge
promhttp_metric_handler_requests_in_flight 1
# HELP promhttp_metric_handler_requests_total Total number of scrapes by HTTP status code.
# TYPE promhttp_metric_handler_requests_total counter
promhttp_metric_handler_requests_total{code="200"} 75
promhttp_metric_handler_requests_total{code="500"} 0
promhttp_metric_handler_requests_total{code="503"} 0
普罗米修斯是如何解读的这些数据
以下是每个指标的解释:
prometheus_web_federation_warnings_total:表示由于与联邦的通信问题而发出的告警总数。promhttp_metric_handler_requests_in_flight:表示当前正在处理的抓取请求的数量。promhttp_metric_handler_requests_total:表示处理过的抓取请求的总数,按HTTP状态代码分类。
在 promhttp_metric_handler_requests_total 指标中,有三个标签 (code="200", code="500" 和 code="503") ,它们分别表示HTTP状态代码为200、500和503的请求总数。
请注意,每个指标都有一个 TYPE 标签,它指定了指标的类型,例如 counter 或 gauge。
3.理解TSDB时序数据库
上述这些数据是来自于一个基于时间序列数据库(Time Series Database,简称TSDB)的监控系统,例如Prometheus,InfluxDB等。
TSDB是专门用于处理和存储时间序列数据的数据库。时间序列数据是指在特定时间点或时间范围内收集的数据,例如系统的CPU使用率、内存使用率、网络流量等。这些数据通常被用于监控系统或应用程序的性能和健康状态。
TSDB通常具有以下特点:
- 高效的数据存储和检索:它可以快速地存储和检索大量的时间序列数据。
- 处理时序数据的特定函数:TSDB通常支持处理时序数据的一些特定函数,例如滑动窗口平均值、最大值、最小值等。
- 支持聚合操作:TSDB支持对大量时间序列数据进行聚合操作,以便生成报告和分析数据。
对于理解TSDB,您需要了解以下术语:
- 时间序列:时间序列是一组在特定时间点或时间范围内测量的值的序列。
- 指标:指标是一个时间序列的名称,例如CPU使用率、内存使用率等。
- 标签:标签是指标的元数据,用于识别和区分不同的时间序列。例如,在上面的示例中,
code是标签,用于区分HTTP状态代码为200、500和503的请求总数。 - 时间戳:时间戳是一个时间序列值的时间戳,通常是一个Unix时间戳或类似的格式。
在TSDB中,数据通常以时间序列的形式存储,每个时间序列由一个指标名称和一组标签组成。时间戳和数据值与时间序列相关联。TSDB通常提供用于查询和聚合数据的API,使您可以对数据进行查询和可视化分析。
tsdb(Time Series Database)
监控数据样本
[root@k8s-master ~/prometheus-all]#curl -s  10.244.1.96:9090/metrics |tail -15
prometheus_tsdb_wal_writes_failed_total 0
# HELP prometheus_web_federation_errors_total Total number of errors that occurred while sending federation responses.
# TYPE prometheus_web_federation_errors_total counter
prometheus_web_federation_errors_total 0
# HELP prometheus_web_federation_warnings_total Total number of warnings that occurred while sending federation responses.
# TYPE prometheus_web_federation_warnings_total counter
prometheus_web_federation_warnings_total 0
# HELP promhttp_metric_handler_requests_in_flight Current number of scrapes being served.
# TYPE promhttp_metric_handler_requests_in_flight gauge
promhttp_metric_handler_requests_in_flight 1
# HELP promhttp_metric_handler_requests_total Total number of scrapes by HTTP status code.
# TYPE promhttp_metric_handler_requests_total counter
promhttp_metric_handler_requests_total{code="200"} 92
promhttp_metric_handler_requests_total{code="500"} 0
promhttp_metric_handler_requests_total{code="503"} 0
在Prometheus中,TSDB(时间序列数据库)是用于存储时序数据的核心组件。以下是您提供的示例中TSDB生成的一些指标:
prometheus_tsdb_head_samples_appended_total- 它是一个计数器,表示添加到头部块的样本数,即最近添加到时间序列数据库的数据点的数量。prometheus_tsdb_wal_fsync_duration_seconds- 它是一个摘要计数器,它记录WAL(Write Ahead Log)刷盘的时间。WAL是用于保护时序数据不会因意外中断而丢失的机制。prometheus_tsdb_wal_corruptions_total- 它是一个计数器,表示WAL文件损坏的次数。如果此计数器的值非零,则可能需要使用prometheus_tsdb_wal_truncate_duration_seconds中的指标来修复WAL文件。prometheus_tsdb_compaction_chunk_size_bytes- 它是一个摘要计数器,表示TSDB压缩时处理的块的大小(以字节为单位)。TSDB会定期将旧的块压缩成更大的块,以减少磁盘使用量。prometheus_tsdb_wal_deletes_total- 它是一个计数器,表示删除的块数。删除块通常是由于已过期或无用的块占用了过多的磁盘空间而进行的。prometheus_tsdb_head_series- 它是一个摘要计数器,表示当前在头部块中存储的唯一时间序列数。这是一个很重要的指标,因为它可以告诉您当前存储的时间序列的数量,帮助您确定是否需要调整数据保留策略以释放更多磁盘空间。prometheus_tsdb_wal_truncate_duration_seconds- 它是一个摘要计数器,记录了用于修复WAL文件的时间。如果prometheus_tsdb_wal_corruptions_total的值非零,则可能需要使用此指标来修复WAL文件。
这些是TSDB中一些常见的指标,它们可以帮助您监视和管理Prometheus的时间序列数据库。
解读参数
其中#号开头的两行分别为:
- HELP开头说明该行为指标的帮助信息,通常解释指标的含义
- TYPE开头是指明了指标的类型
- counter 计数器
- guage 测量器
- histogram 柱状图
- summary 采样点分位图统计
其中非#开头的每一行表示当前采集到的一个监控样本:
- promhttp_metric_handler_requests_total表明了当前指标的名称
- 大括号中的标签则反映了当前样本的一些特征和维度
- 浮点数则是该监控
样本的具体值。
每次采集到的数据都会被Prometheus以time-series(时间序列)的方式保存到内存中,定期刷新到硬盘。
如下所示,可以将time-series理解为一个以时间为X轴的数字矩阵:
 ^
  │   . . . . . . . . . . . . . . . . .   . .   node_cpu{cpu="cpu0",mode="idle"}
  │     . . . . . . . . . . . . . . . . . . .   node_cpu{cpu="cpu0",mode="system"}
  │     . . . . . . . . . .   . . . . . . . .   node_load1{}
  │     . . . . . . . . . . . . . . . .   . .
  v
    <------------------ 时间 ---------------->
在time-series中的每一个点称为一个样本(sample),样本由以下三部分组成:
- 指标(metric):metric name和描述当前样本特征的labelsets;
- 时间戳(timestamp):一个精确到毫秒的时间戳;
- 样本值(value): 一个float64的浮点型数据表示当前样本的值。
在形式上,所有的指标(Metric)都通过如下格式标示:
<metric name>{<label name>=<label value>, ...}
- 指标的名称(metric name)可以反映被监控样本的含义(比如,
http_request_total- 表示当前系统接收到的HTTP请求总量)。 - 标签(label)反映了当前样本的特征维度,通过这些维度Prometheus可以对样本数据进行过滤,聚合等。
小结
初学只需要知道这个即可:
Prometheus:定期去Tragets列表拉取监控数据,存储到TSDB中,并且提供指标查询、分析的语句和接口。