Alertmanager告警系统
Prometheus是一个开源的监控系统,它可以帮助用户监控他们的应用程序、服务和基础设施,并提供有关它们运行状况的实时度量数据。为了让用户能够及时了解监控数据的变化情况,Prometheus提供了Alertmanager,它是一个用于管理告警的组件。
Alertmanager可以从Prometheus收集告警规则,然后对其进行处理和路由。当Prometheus发现系统中存在异常的度量数据时,它会向Alertmanager发送一个告警通知。Alertmanager会根据事先配置好的规则,对这些告警进行分类、过滤和处理,并将它们发送到指定的接收器上。这些接收器可以是邮件、Slack、PagerDuty等等。此外,Alertmanager还提供了自定义模板,可以用于创建具有用户定义格式的告警通知。
总之,Alertmanager可以帮助用户更加有效地管理和处理告警,从而及时解决可能的问题,确保系统稳定运行。
是什么
Alertmanager是一个独立的告警模块。
- 接收Prometheus等客户端发来的警报
- 通过分组、删除重复等处理,并将它们通过路由发送给正确的接收器;
- 告警方式可以按照不同的规则发送给不同的模块负责人。Alertmanager支持Email, Slack,等告警方式, 也可以通过webhook接入钉钉等国内IM工具。
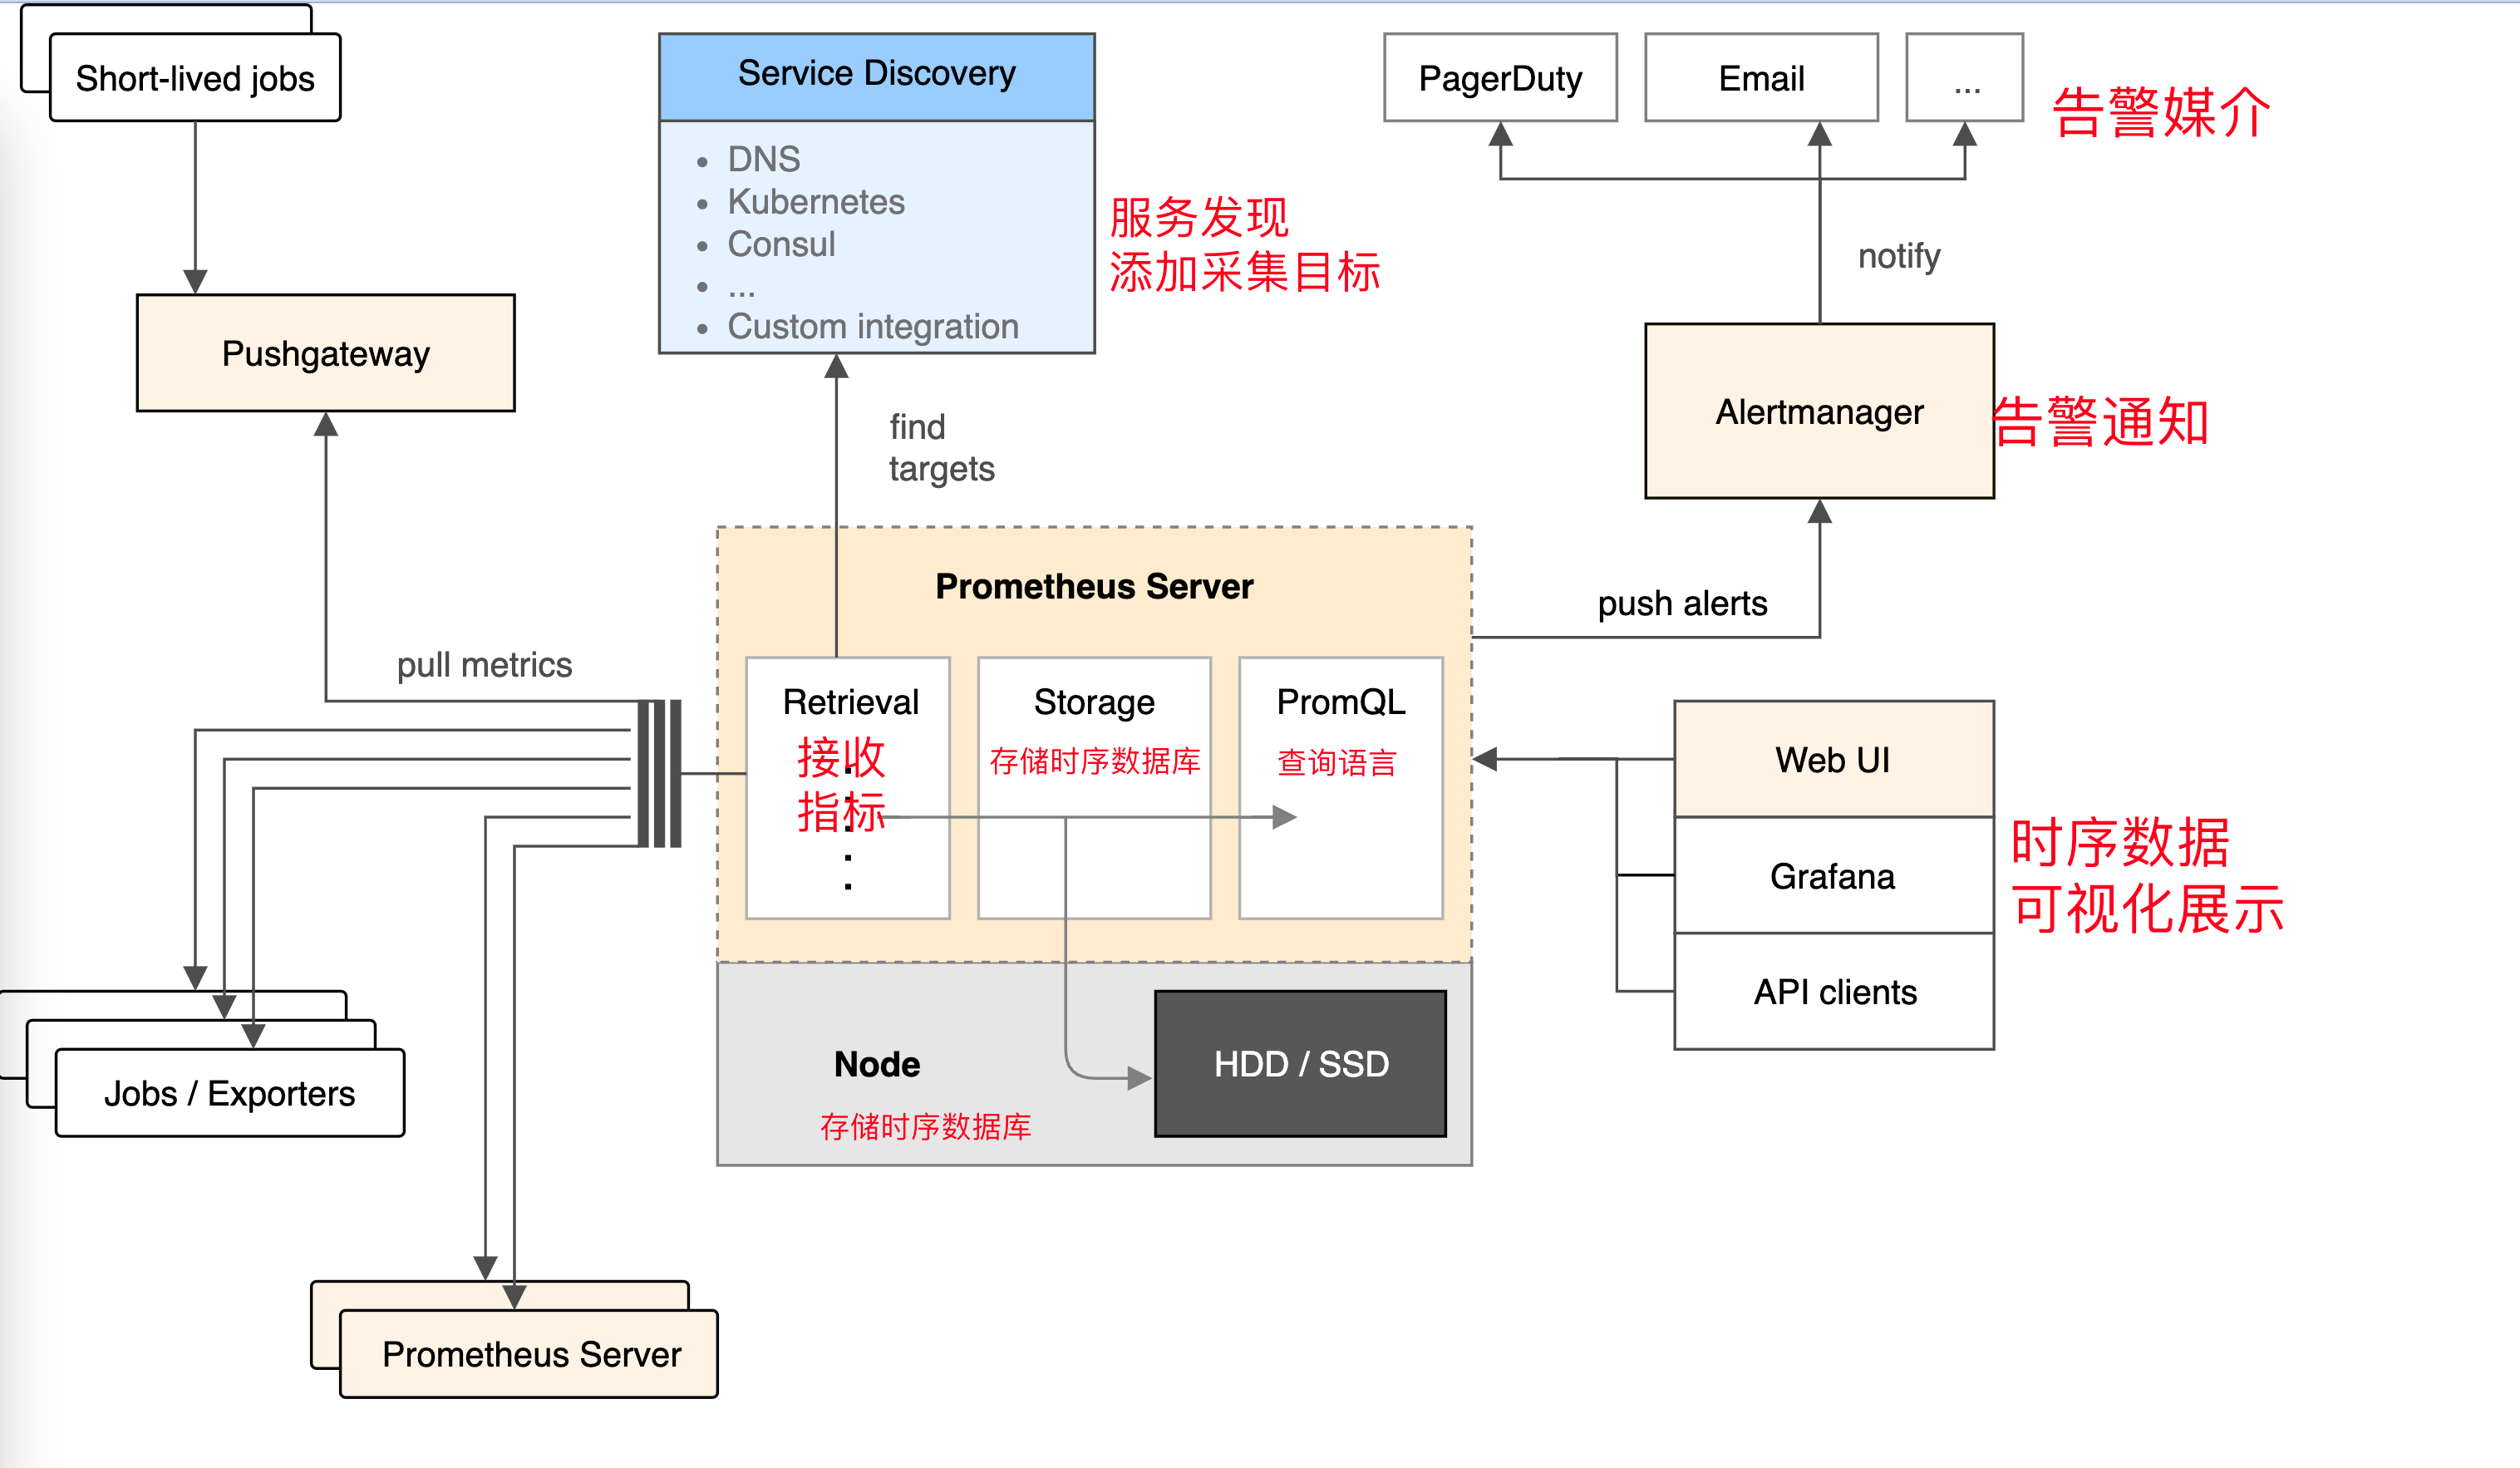

如果集群主机的内存使用率超过80%,且该现象持续了2分钟?想实现这样的监控告警,如何做?
从上图可得知设置警报和通知的主要步骤是:
安装和配置 Alertmanager
配置Prometheus与Alertmanager对话
在Prometheus中创建警报规则
安装
# Alertmanager,  https://github.com/prometheus/alertmanager#install

# 都是由go语言开发,获取二进制文件就可以启动
./alertmanager --config.file=config.yml
alertmanager.yml
这是一个用 YAML 格式编写的 Kubernetes 监控系统中 Alertmanager 组件的配置文件。它定义了 Alertmanager 的各种设置,例如解决告警的超时时间、用于发送电子邮件的 SMTP 服务器和身份验证信息,以及告警的路由和分组方式。
global 部分设置了 Alertmanager 的全局配置。route 部分设置了告警的路由规则,以及如何对告警进行分组和分发到接收者。receivers 部分定义了接收者及其各自的配置,例如发送告警的电子邮件地址以及是否发送已解决告警的通知。
此配置文件还包括注释,用 # 字符标记,并提供有关每个设置的附加信息。注释由 YAML 解析器忽略,不会影响配置。
$ cat config.yml
apiVersion: v1
data:
  config.yml: |
    global:
      # 当alertmanager持续多长时间未接收到告警后标记告警状态为 resolved
      resolve_timeout: 5m
      # 配置邮件发送信息
      smtp_smarthost: 'smtp.163.com:25'
      smtp_from: 'yc_uuu@163.com'
      smtp_auth_username: 'yc_uuu@163.com'
      smtp_auth_password: 'NCCSNHHYDGYJVLKL'
      smtp_require_tls: false
    # 所有报警信息进入后的根路由,用来设置报警的分发策略
    route:
      # 接收到的报警信息里面有许多alertname=NodeLoadHigh 这样的标签的报警信息将会批量被聚合到一个分组里面
      group_by: ['alertname']
      # 当一个新的报警分组被创建后,需要等待至少 group_wait 时间来初始化通知,如果在等待时间内当前group接收到了新的告警,这些告警将会合并为一个通知向receiver发送
      group_wait: 30s

      # 相同的group发送告警通知的时间间隔
      group_interval: 30s
      # 如果一个报警信息已经发送成功了,等待 repeat_interval 时间来重新发送
      repeat_interval: 1m

      # 默认的receiver:如果一个报警没有被一个route匹配,则发送给默认的接收器
      receiver: default

      # 上面所有的属性都由所有子路由继承,并且可以在每个子路由上进行覆盖。
      routes:
      - {}
    # 配置告警接收者的信息
    receivers:
    - name: 'default'
      email_configs:
      - to: '877348180@qq.com'
        send_resolved: true  # 接受告警恢复的通知
kind: ConfigMap
metadata:
  name: alertmanager
  namespace: monitor
主要配置的作用:
- global: 全局配置,包括报警解决后的超时时间、SMTP 相关配置、各种渠道通知的 API 地址等等。
- route: 用来设置报警的分发策略,它是一个树状结构,按照深度优先从左向右的顺序进行匹配。
- receivers: 配置告警消息接受者信息,例如常用的 email、wechat、slack、webhook 等消息通知方式。
当alertmanager接收到一条新的alert时,会先根据group_by为其确定一个聚合组group,然后等待group_wait时间,如果在此期间接收到同一group的其他alert,则这些alert会被合并,然后再发送(alertmanager发送消息单位是group)。此参数的作用是防止短时间内出现大量告警的情况下,接收者被告警淹没。
在该组的alert第一次被发送后,该组会进入睡眠/唤醒周期,睡眠周期将持续group_interval时间,在睡眠状态下该group不会进行任何发送告警的操作(但会插入/更新(根据fingerprint)group中的内容),睡眠结束后进入唤醒状态,然后检查是否需要发送新的alert或者重复已发送的alert(resolved类型的alert在发送完后会从group中剔除)。这就是group_interval的作用。
聚合组在每次唤醒才会检查上一次发送alert是否已经超过repeat_interval时间,如果超过则再次发送该告警。
创建configmap
$ kubectl apply -f config.yml
后台启动
$ cat alertmanager-all.yaml
apiVersion: apps/v1
kind: Deployment
metadata:
  name: alertmanager
  namespace: monitor
  labels:
    app: alertmanager
spec:
  selector:
    matchLabels:
      app: alertmanager
  template:
    metadata:
      labels:
        app: alertmanager
    spec:
      volumes:
      - name: config
        configMap:
          name: alertmanager
      containers:
      - name: alertmanager
        image: prom/alertmanager:v0.21.0
        imagePullPolicy: IfNotPresent
        args:
        - "--config.file=/etc/alertmanager/config.yml"
        - "--log.level=debug"
        ports:
        - containerPort: 9093
          name: http
        volumeMounts:
        - mountPath: "/etc/alertmanager"
          name: config
        resources:
          requests:
            cpu: 100m
            memory: 256Mi
          limits:
            cpu: 100m
            memory: 256Mi
---
apiVersion: v1
kind: Service
metadata:
  name: alertmanager
  namespace: monitor
spec:
  type: ClusterIP
  ports:
    - port: 9093
  selector:
    app: alertmanager

---
apiVersion: networking.k8s.io/v1
kind: Ingress
metadata:
  name: alertmanager
  namespace: monitor
spec:
  rules:
  - host: alertmanager.yuchaoit.cn
    http:
      paths:
      - path: /
        pathType: Prefix
        backend:
          service:
            name: alertmanager
            port:
              number: 9093
创建查看
[root@k8s-master ~/prometheus-all]#kubectl apply -f alertmanager-all.yaml
deployment.apps/alertmanager created
service/alertmanager created
ingress.networking.k8s.io/alertmanager created


[root@k8s-master ~/prometheus-all]#kubectl -n monitor get po
NAME                                 READY   STATUS    RESTARTS      AGE
alertmanager-6d6dd4bcc5-fbssh        1/1     Running   0             109s
grafana-5588cfdb99-94chv             1/1     Running   1 (29m ago)   19h
kube-state-metrics-7dc6bc9d6-bpscm   1/1     Running   1 (29m ago)   24h
node-exporter-68n2w                  1/1     Running   1 (29m ago)   6d18h
node-exporter-6z9sj                  1/1     Running   1 (29m ago)   6d18h
node-exporter-rkrgh                  1/1     Running   1 (29m ago)   6d18h
prometheus-6c8768547-v7hqq           1/1     Running   1 (29m ago)   6d20h

[root@k8s-master ~/prometheus-all]#kubectl -n monitor get svc
NAME                 TYPE        CLUSTER-IP      EXTERNAL-IP   PORT(S)             AGE
alertmanager         ClusterIP   10.106.2.206    <none>        9093/TCP            119s
grafana              ClusterIP   10.96.83.217    <none>        3000/TCP            19h
kube-state-metrics   ClusterIP   None            <none>        8080/TCP,8081/TCP   24h
prometheus           ClusterIP   10.109.81.166   <none>        9090/TCP            6d20h


[root@k8s-master ~/prometheus-all]#kubectl -n monitor get ingress
NAME           CLASS    HOSTS                      ADDRESS   PORTS   AGE
alertmanager   <none>   alertmanager.yuchaoit.cn             80      2m3s
grafana        nginx    grafana.yuchaoit.cn                  80      19h
prometheus     nginx    prometheus.yuchaoit.cn               80      6d20h
configmap获取技巧
如果configmap出现格式错乱,可以进入容器内,拿到配置文件yml
[root@k8s-master ~/prometheus-all]#kubectl -n monitor exec prometheus-6c8768547-v7hqq -- cat /etc/prometheus/prometheus.yml > /tmp/prometheus.yml
Defaulted container "prometheus" out of: prometheus, change-permission-of-directory (init)
配置Prometheus与Alertmanager
在Prometheus中,规则表达式可以用来定义告警规则,一旦规则表达式匹配到某些时间序列的值,Prometheus将会触发告警并将其发送给Alertmanager。Alertmanager则负责接收这些告警,并根据配置的路由规则将其发送到相应的接收者,如邮件、Slack等。
因此,需要在Prometheus的配置文件中指定Alertmanager的地址,以便Prometheus知道将告警发送到哪个Alertmanager实例。在Prometheus的配置文件中,可以通过设置alerting部分的alertmanagers字段来指定Alertmanager的地址。
是否告警是由Prometheus进行判断的,若有告警产生,Prometheus会将告警push到Alertmanager,因此,需要在Prometheus端配置alertmanager的地址:
# 若是configmap乱码,无法修改用如下办法解决
如果configmap出现格式错乱,可以进入容器内,拿到配置文件yml
[root@k8s-master ~/prometheus-all]#kubectl -n monitor exec prometheus-6c8768547-v7hqq -- cat /etc/prometheus/prometheus.yml > /tmp/prometheus.yml
Defaulted container "prometheus" out of: prometheus, change-permission-of-directory (init)


# 修改yaml
[root@k8s-master ~/prometheus-all]#vim /tmp/prometheus.yml
...
global:
  scrape_interval:     15s # Set the scrape interval to every 15 seconds. Default is every 1 minute.
  evaluation_interval: 15s # Evaluate rules every 15 seconds. The default is every 1 minute.
  # scrape_timeout is set to the global default (10s).

# Alertmanager configuration
alerting:
  alertmanagers:
  - static_configs:
    - targets:
      - alertmanager:9093
...

# 重建configmap
[root@k8s-master ~/prometheus-all]#kubectl -n monitor delete configmaps prometheus-config
configmap "prometheus-config" deleted

[root@k8s-master ~/prometheus-all]#kubectl -n monitor create configmap prometheus-config --from-file=/tmp/prometheus.yml
configmap/prometheus-config created

# 检查
[root@k8s-master ~/prometheus-all]#kubectl -n monitor exec prometheus-6c8768547-v7hqq -- cat /etc/prometheus/prometheus.yml  |grep alert
Defaulted container "prometheus" out of: prometheus, change-permission-of-directory (init)
alerting:
  alertmanagers:

# 重载普罗米修斯
[root@k8s-master ~]#curl -X POST 10.109.81.166:9090/-/reload

# 查看应用日志
[root@k8s-master ~/prometheus-all]#kubectl -n monitor logs prometheus-6c8768547-v7hqq -f --tail=10
监控与告警
如下是普罗米修斯的配置
global:
  scrape_interval:     15s # Set the scrape interval to every 15 seconds. Default is every 1 minute.
  evaluation_interval: 15s # Evaluate rules every 15 seconds. The default is every 1 minute.
  # scrape_timeout is set to the global default (10s).

# Alertmanager configuration
alerting:
  alertmanagers:
  - static_configs:
    - targets:
      - alertmanager:9093

# Load rules once and periodically evaluate them according to the global 'evaluation_interval'.
rule_files:
  # - "first_rules.yml"
  # - "second_rules.yml"

# A scrape configuration containing exactly one endpoint to scrape:
# Here it's Prometheus itself.
scrape_configs:
  # The job name is added as a label `job=<job_name>` to any timeseries scraped from this config.
  - job_name: 'prometheus'
    static_configs:
    - targets: ['localhost:9090']
这是一个Prometheus的配置文件,它包含三个部分:
global部分:定义了一些全局配置,包括抓取间隔(scrape_interval)、规则评估间隔(evaluation_interval)等。这些全局配置会被应用到所有的抓取目标和规则文件中。alerting部分:定义了将告警发送到Alertmanager的配置。alertmanagers字段指定了一个Alertmanager的地址,Prometheus将告警发送到这个地址。可以指定多个Alertmanager实例,这里只指定了一个。在实际应用中,需要根据具体需求配置这些字段。rule_files部分指定了 Prometheus 要加载的规则文件列表。规则文件中包含了用户自定义的一些规则,例如监控某个指标的阈值等。Prometheus 会周期性地读取这些规则文件并对它们进行评估,以检测是否有任何触发规则的指标。在这个例子中,注释掉了两个规则文件的定义,即没有任何自定义规则被加载。在实际使用中,可以定义多个规则文件,以根据需要监控多个指标,并对它们进行自定义的规则评估。scrape_configs部分:定义了抓取配置。Prometheus会按照这里的配置周期性地抓取指定的目标,并将其保存到时间序列数据库中。这里只包含一个抓取目标,即Prometheus自身。在实际应用中,需要根据具体需求配置多个抓取目标,例如其他服务或应用的指标。
添加告警规则
目前Prometheus与Alertmanager已经连通,接下来我们可以针对收集到的各类指标配置报警规则,一旦满足报警规则的设置,则Prometheus将报警信息推送给Alertmanager,进而转发到我们配置的邮件中。
在哪里配置?同样是在prometheus-configmap中:
# 修改告警部分配置
[root@k8s-master ~/prometheus-all]#vim /tmp/prometheus.yml

# 如下
global:
  scrape_interval:     15s # Set the scrape interval to every 15 seconds. Default is every 1 minute.
  evaluation_interval: 15s # Evaluate rules every 15 seconds. The default is every 1 minute.
  # scrape_timeout is set to the global default (10s).

# Alertmanager configuration
alerting:
  alertmanagers:
  - static_configs:
    - targets:
      - alertmanager:9093

# Load rules once and periodically evaluate them according to the global 'evaluation_interval'.
rule_files:
  - /etc/prometheus/alert_rules.yml # 挂到普罗米修斯目录下就行
  # - "first_rules.yml"
  # - "second_rules.yml"
创建configmap
alert_rules.yml我们同样使用configmap的方式挂载到prometheus容器内部就行。
并且是和普罗米修斯同一个目录下
groups:
- name: node_metrics
  rules:
  - alert: NodeLoad
    expr: node_load15 < 1 # 指标表达式
    for: 2m # 持续2分钟
    annotations: # 注释
      summary: ": Low node load detected"
      description: ": node load is below 1 (current value is: "
这是一个Prometheus的报警规则配置,其中包括了一个名为 node_metrics 的规则组,以及一个名为 NodeLoad 的报警规则。
该报警规则的含义是:如果在 2 分钟内 node_load15 的平均负载小于 1,则触发报警。同时,还配置了报警信息的摘要和详细描述。其中,用于获取该指标所对应的实例标签, 用于获取当前指标的值。
这些规则需要通过配置文件的方式,加载到 Prometheus 中。在 Prometheus 配置文件中,可以通过 rule_files 字段来指定报警规则文件的位置。
重建configmap即可,挂载2个配置文件
[root@k8s-master ~/prometheus-all]#kubectl -n monitor delete configmaps prometheus-config
configmap "prometheus-config" deleted

[root@k8s-master ~/prometheus-all]#kubectl -n monitor create configmap prometheus-config --from-file=/tmp/prometheus.yml --from-file=/tmp/alert_rules.yml
configmap/prometheus-config created

# 检查配置文件是否挂到容器里
[root@k8s-master ~/prometheus-all]#kubectl -n monitor exec prometheus-6c8768547-v7hqq -- ls /etc/prometheus
Defaulted container "prometheus" out of: prometheus, change-permission-of-directory (init)
alert_rules.yml
prometheus.yml

# 重载普罗米修斯
[root@k8s-master ~/prometheus-all]#curl -X POST 10.109.81.166:9090/-/reload
查看普罗米修斯Alters
Inactive:指当前没有任何触发条件满足告警规则,因此告警处于未激活状态。Pending:指有触发条件满足告警规则,但还未达到指定的持续时间(for)要求,因此告警处于等待状态。Firing:指有触发条件满足告警规则,且已经持续达到指定的持续时间(for)要求,因此告警处于发送中状态。
注意,在告警规则中,可以设置 unprocessed 和 resolved 状态,分别表示告警尚未处理和告警已经解决。这些状态通常在告警处理中心或工单系统中使用。
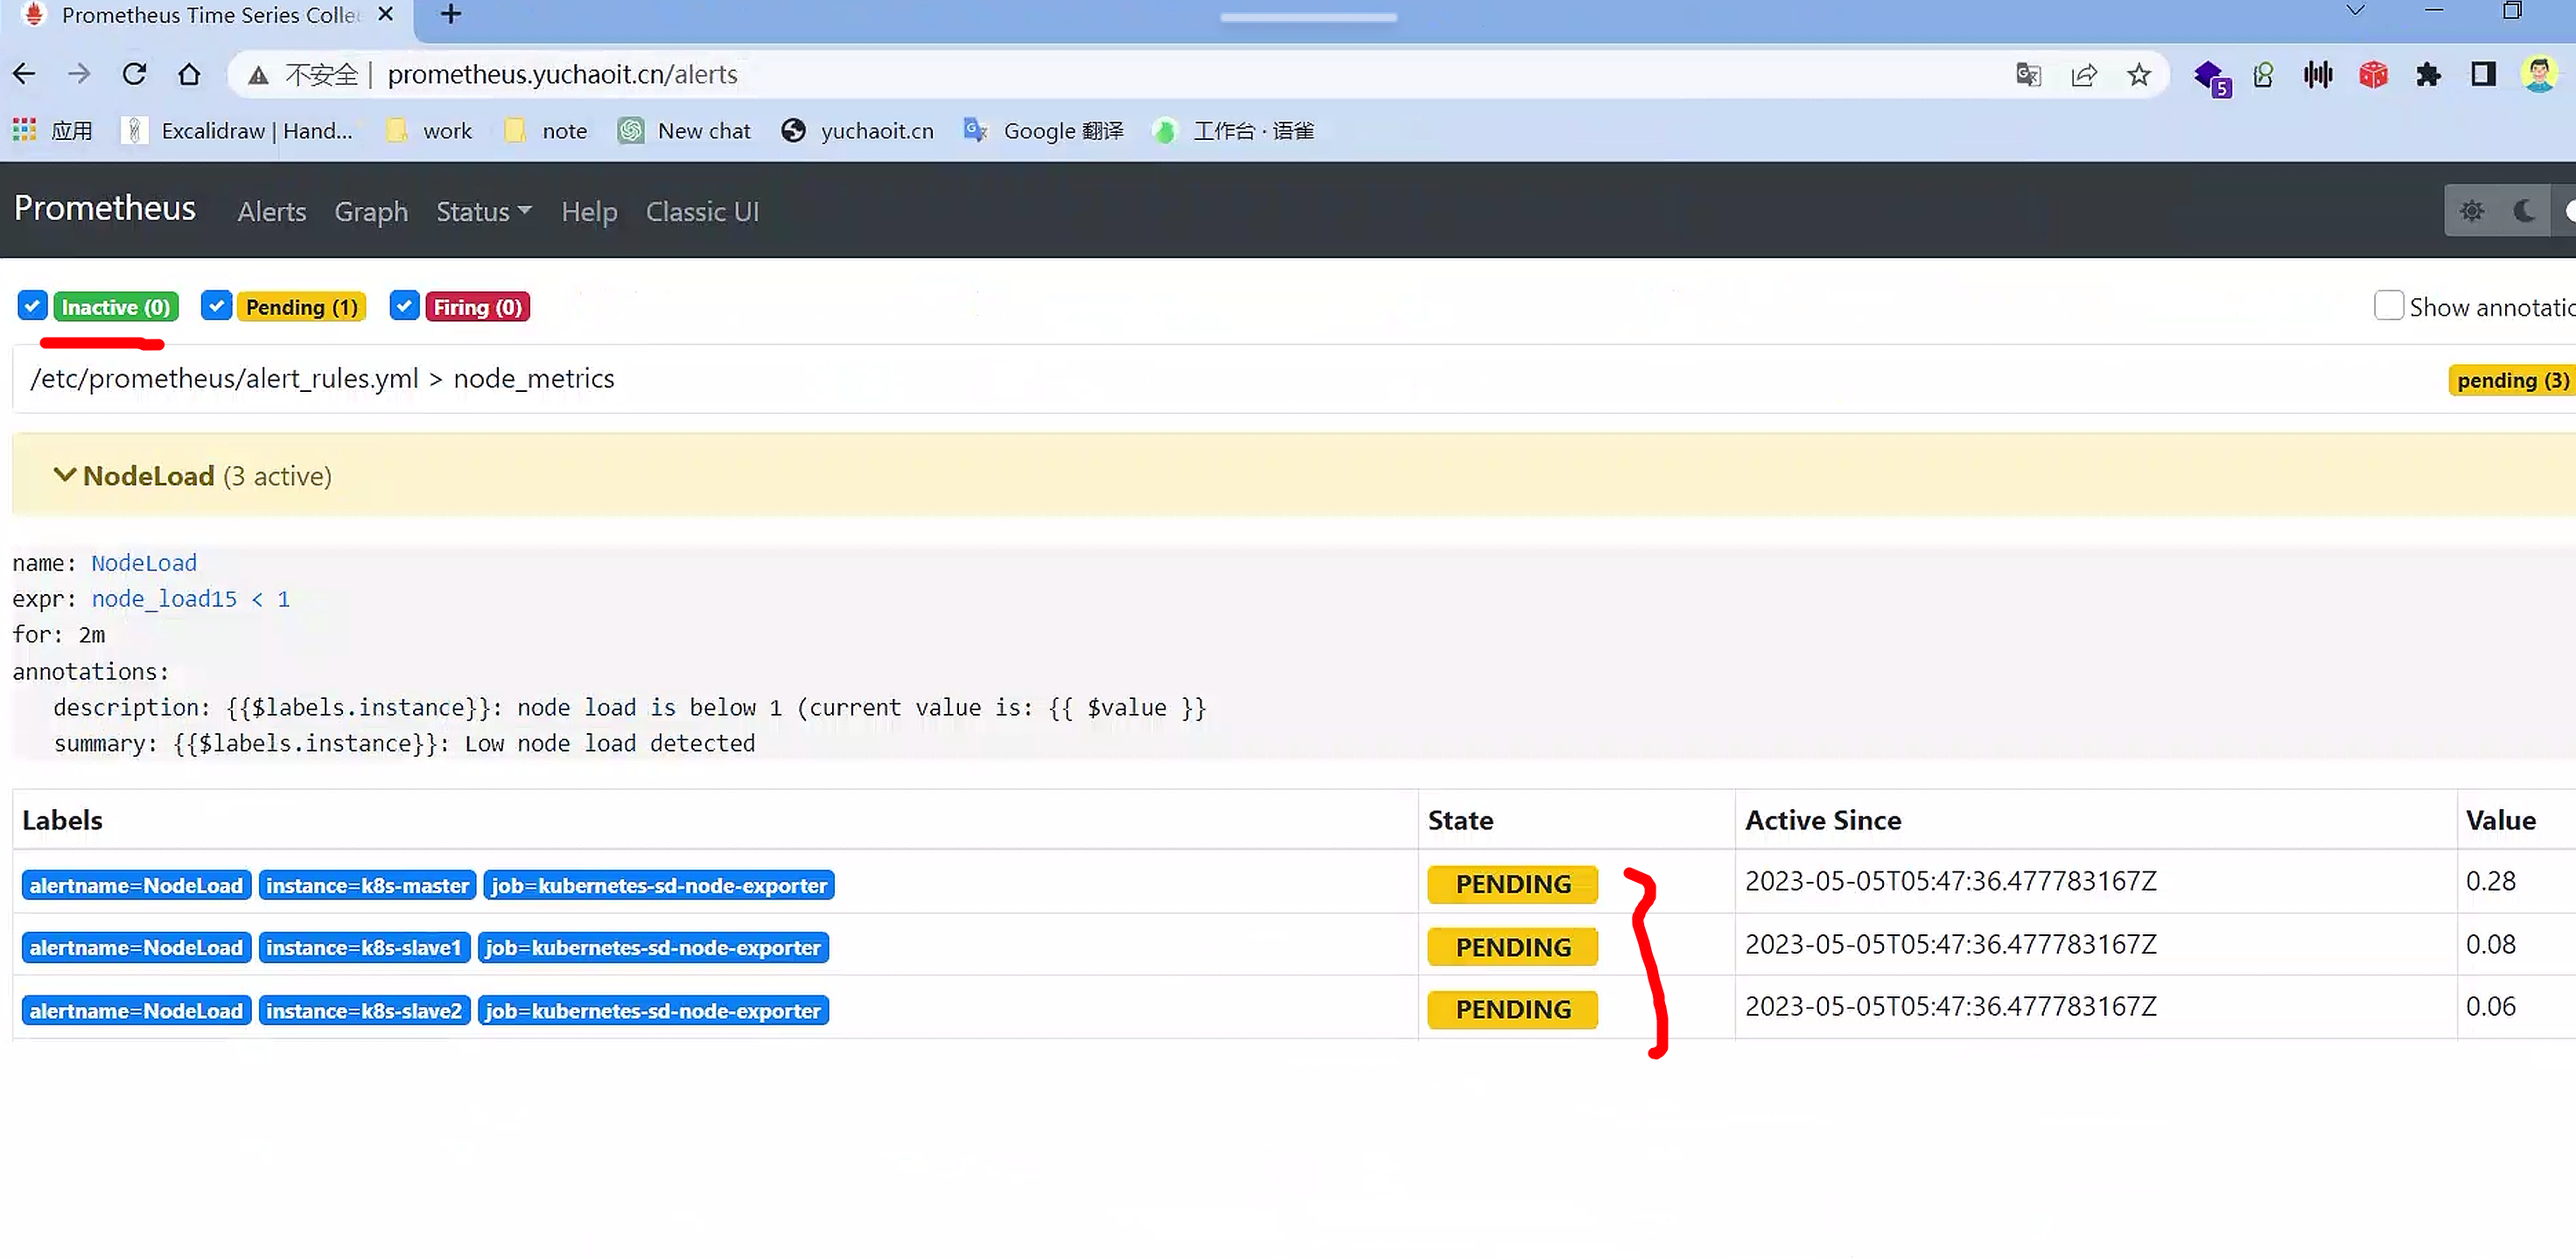
报警功能还没激活,默认30秒评估一次
node_load15 < 1
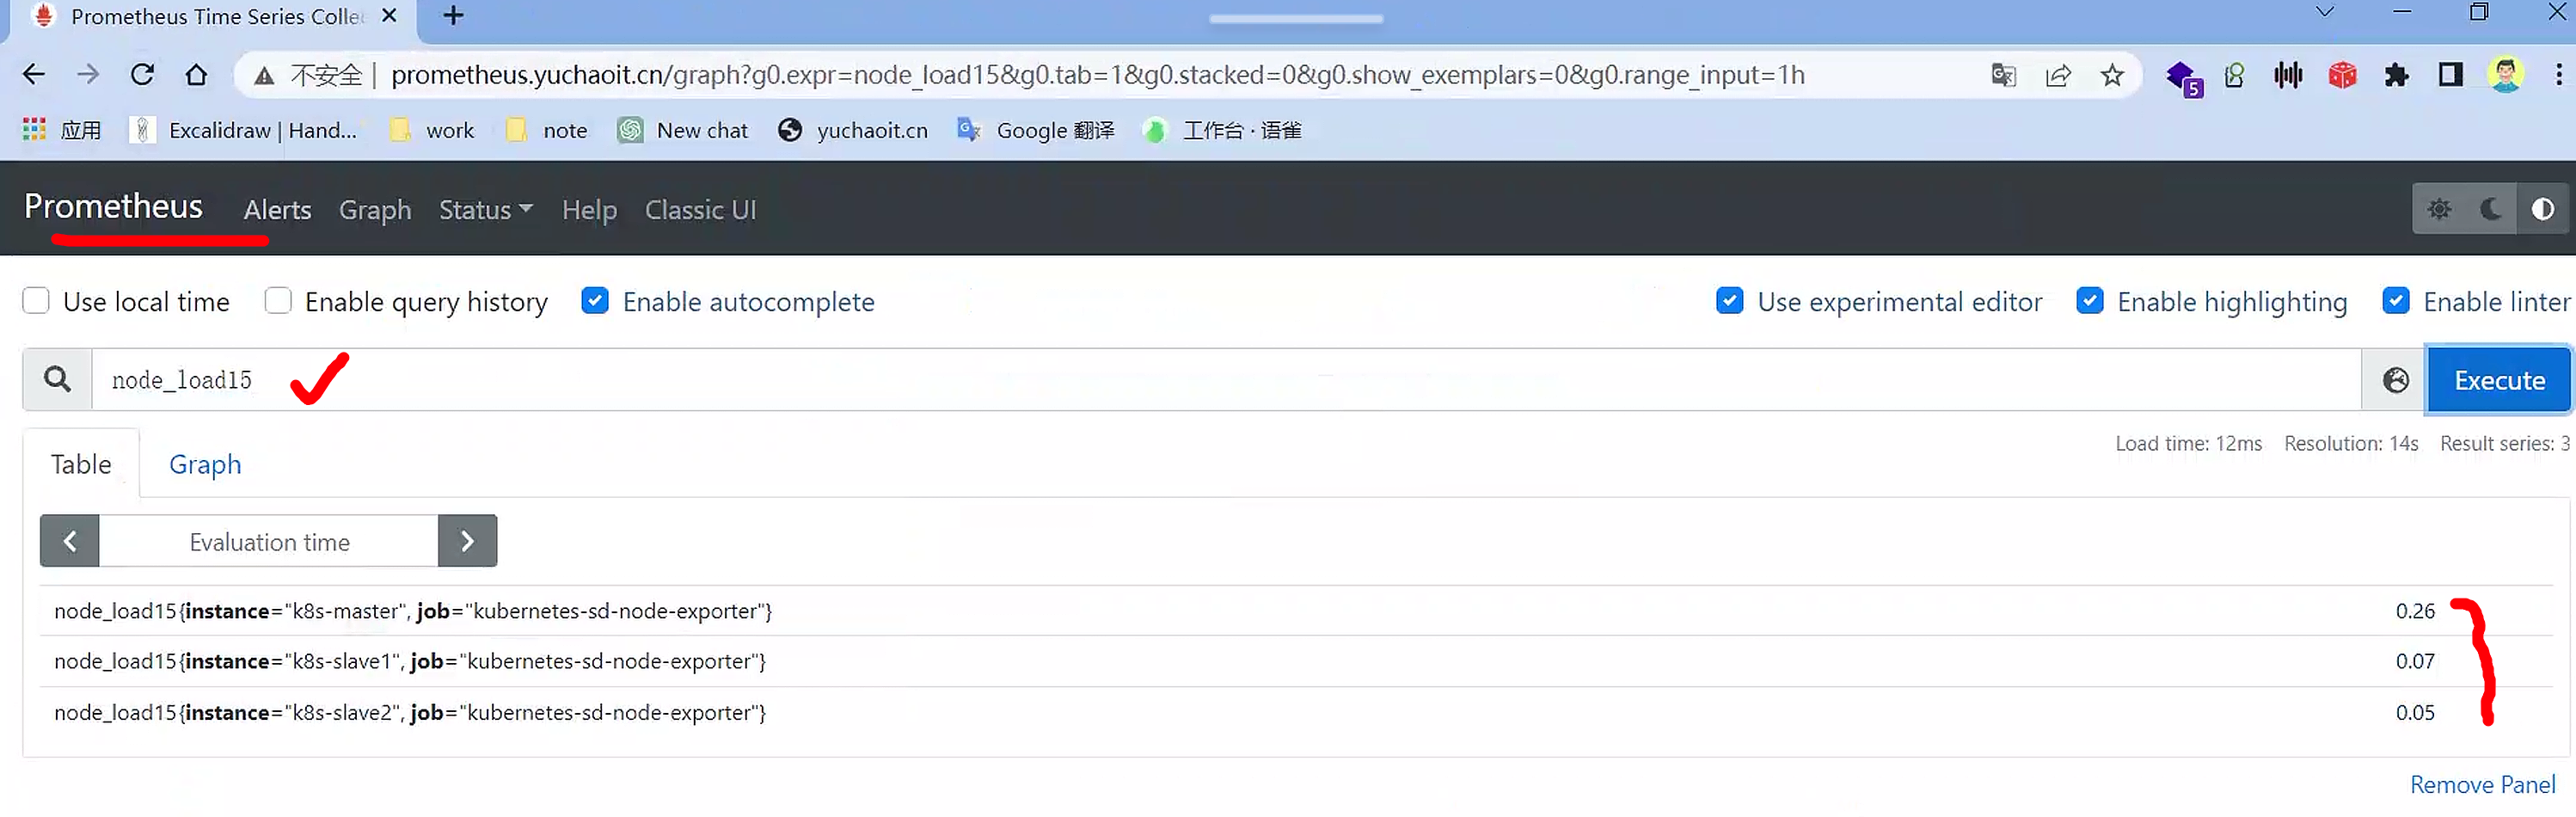
查看告警指标
也都是以时序数据库存储的
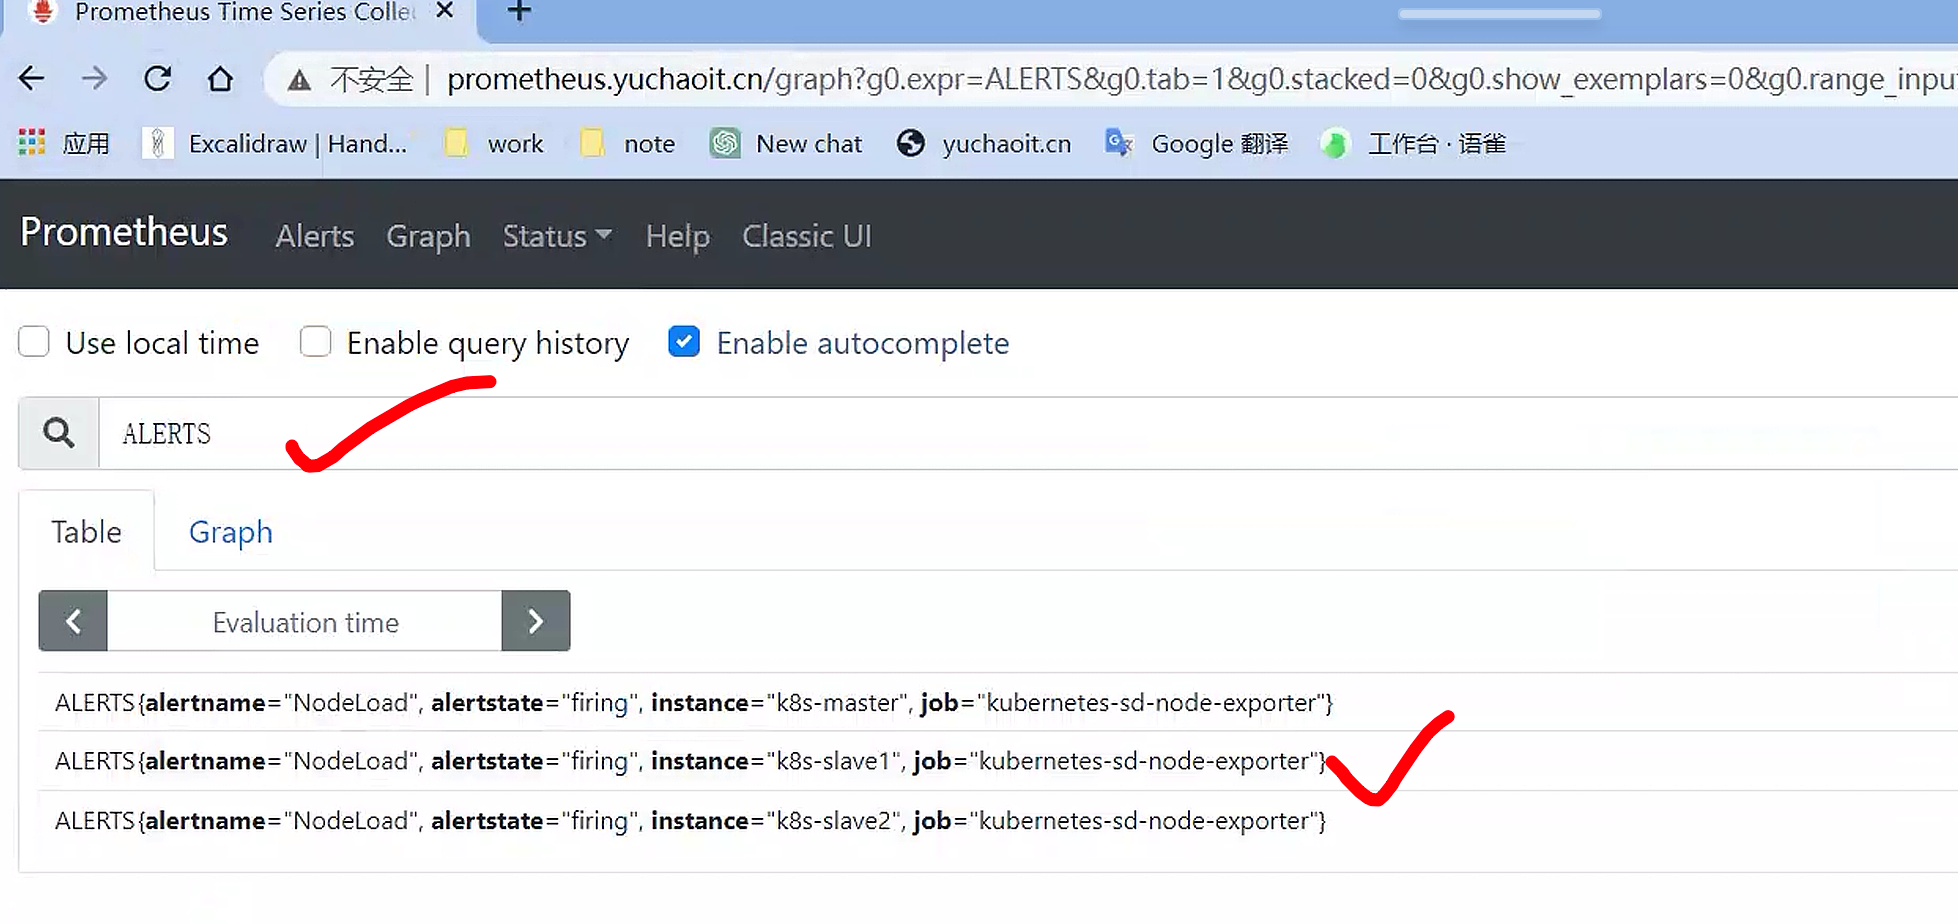
报警发送中

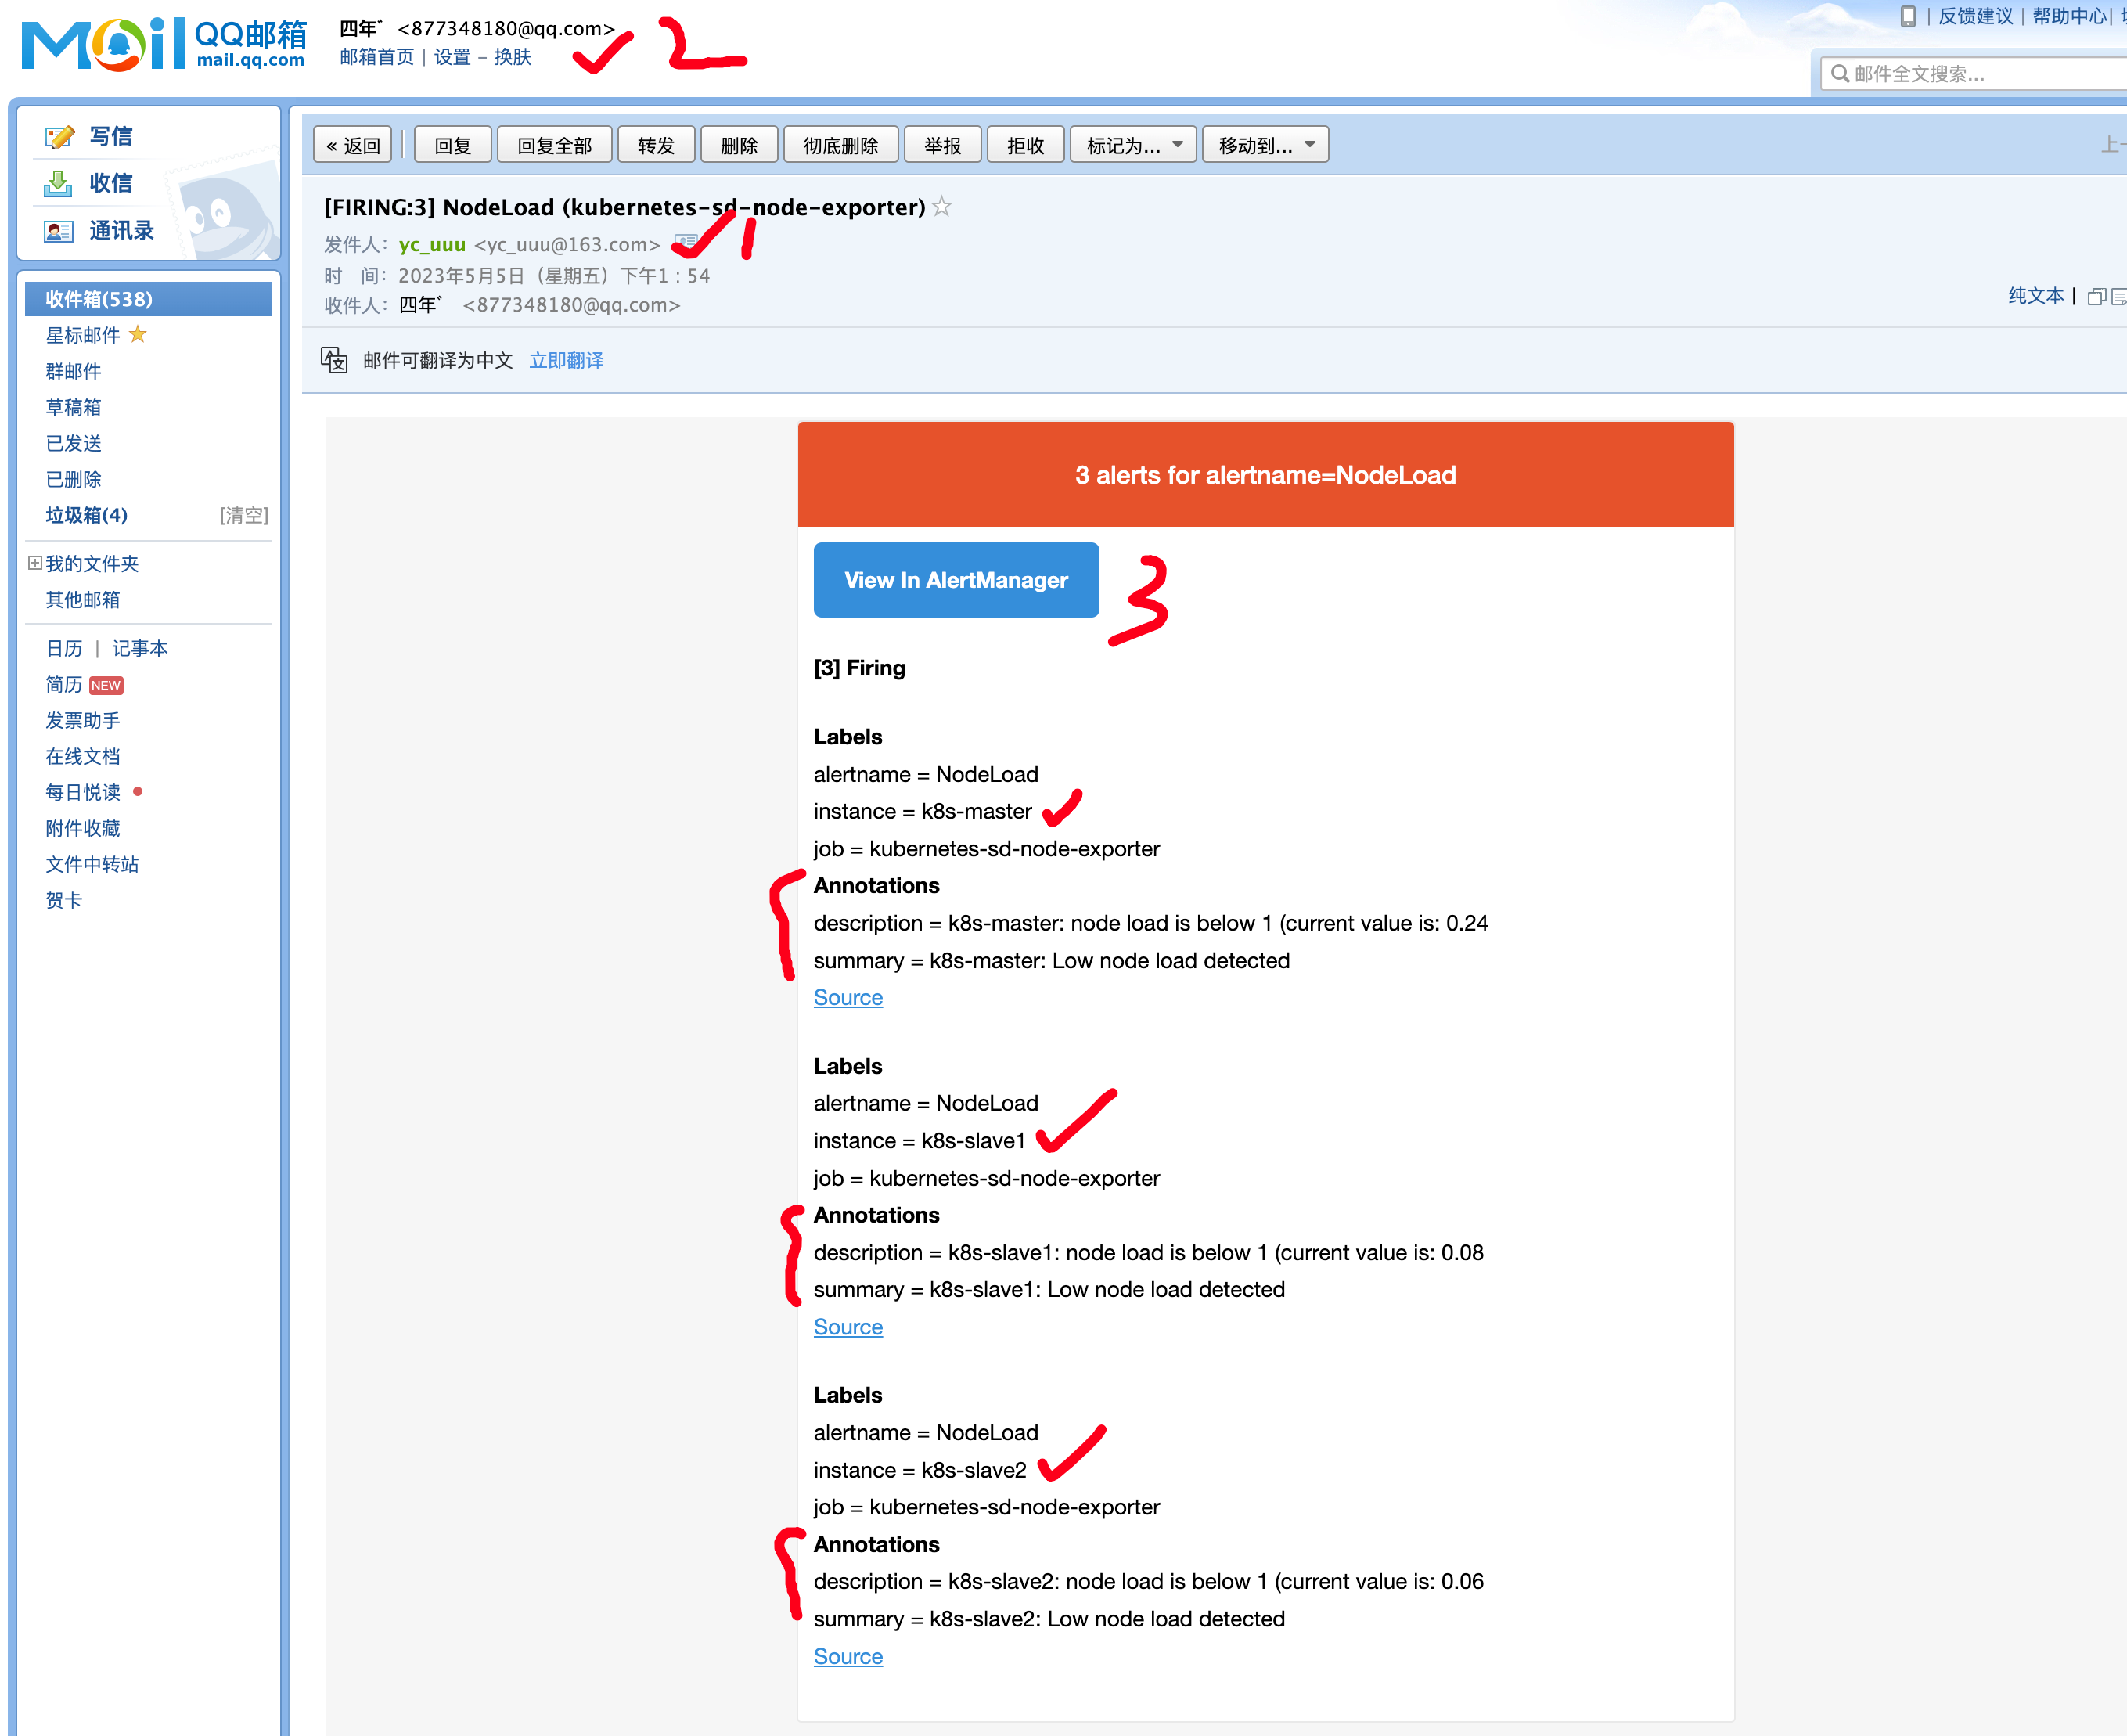
查看告警邮件
查看alertmanager应用日志
[root@k8s-master ~/prometheus-all]#kubectl -n monitor logs alertmanager-6d6dd4bcc5-fbssh --tail=10
level=debug ts=2023-05-05T05:54:36.481Z caller=dispatch.go:138 component=dispatcher msg="Received alert" alert=NodeLoad[b131006][active]
level=debug ts=2023-05-05T05:54:36.491Z caller=dispatch.go:473 component=dispatcher aggrGroup="{}/{}:{alertname=\"NodeLoad\"}" msg=flushing alerts="[NodeLoad[deaf86a][active] NodeLoad[5d17874][active] NodeLoad[b131006][active]]"
level=debug ts=2023-05-05T05:54:36.747Z caller=notify.go:685 component=dispatcher receiver=default integration=email[0] msg="Notify success" attempts=1
level=debug ts=2023-05-05T05:55:06.491Z caller=dispatch.go:473 component=dispatcher aggrGroup="{}/{}:{alertname=\"NodeLoad\"}" msg=flushing alerts="[NodeLoad[deaf86a][active] NodeLoad[5d17874][active] NodeLoad[b131006][active]]"
level=debug ts=2023-05-05T05:55:36.491Z caller=dispatch.go:473 component=dispatcher aggrGroup="{}/{}:{alertname=\"NodeLoad\"}" msg=flushing alerts="[NodeLoad[deaf86a][active] NodeLoad[5d17874][active] NodeLoad[b131006][active]]"
level=debug ts=2023-05-05T05:55:51.482Z caller=dispatch.go:138 component=dispatcher msg="Received alert" alert=NodeLoad[deaf86a][active]
level=debug ts=2023-05-05T05:55:51.482Z caller=dispatch.go:138 component=dispatcher msg="Received alert" alert=NodeLoad[5d17874][active]
level=debug ts=2023-05-05T05:55:51.482Z caller=dispatch.go:138 component=dispatcher msg="Received alert" alert=NodeLoad[b131006][active]
level=debug ts=2023-05-05T05:56:06.492Z caller=dispatch.go:473 component=dispatcher aggrGroup="{}/{}:{alertname=\"NodeLoad\"}" msg=flushing alerts="[NodeLoad[deaf86a][active] NodeLoad[5d17874][active] NodeLoad[b131006][active]]"
level=debug ts=2023-05-05T05:56:06.705Z caller=notify.go:685 component=dispatcher receiver=default integration=email[0] msg="Notify success" attempts=1
[root@k8s-master ~/prometheus-all]#
这段日志显示了Alertmanager的一些操作:
- 在2023-05-05 05:54:36,Alertmanager收到了名为"NodeLoad"的3个活跃告警,并将它们聚合到一个组中。
- 在该组中的告警被刷新并发送到默认的邮件接收器。
- 在2023-05-05 05:55:51,Alertmanager又收到了同样的3个活跃告警。
- 在这一次,告警没有被聚合到同一个组中,而是被分别处理。
- 这些告警再次被刷新并发送到默认的邮件接收器。
告警要素
告警规则的几个要素:
group.name:告警分组的名称,一个组下可以配置一类告警规则,比如都是物理节点相关的告警alert:告警规则的名称expr:是用于进行报警规则 PromQL 查询语句,expr通常是布尔表达式,可以让Prometheus根据计算的指标值做 true or false 的判断for:评估等待时间(Pending Duration),用于表示只有当触发条件持续一段时间后才发送告警,在等待期间新产生的告警状态为pending,屏蔽掉瞬时的问题,把焦点放在真正有持续影响的问题上labels:自定义标签,允许用户指定额外的标签列表,把它们附加在告警上,可以用于后面做路由判断,通知到不同的终端,通常被用于添加告警级别的标签annotations:指定了另一组标签,它们不被当做告警实例的身份标识,它们经常用于存储一些额外的信息,用于报警信息的展示之类的
规则配置中,支持模板的方式,其中:
可以获取当前指标的所有标签,支持或者这种形式
可以获取当前计算出的指标值
告警规则
更新配置并软重启,并查看Prometheus报警规则。
一个报警信息在生命周期内有下面3种状态:
inactive: 表示当前报警信息处于非活动状态,即不满足报警条件pending: 表示在设置的阈值时间范围内被激活了,即满足报警条件,但是还在观察期内firing: 表示超过设置的阈值时间被激活了,即满足报警条件,且报警触发时间超过了观察期,会发送到Alertmanager端
钉钉告警
在 Prometheus 的 Alertmanager 中,可以配置多个 receivers,每个 receiver 都是一组通知方式,可以针对不同的告警规则配置不同的 receiver,以便把告警通知发送给不同的团队或个人。
每个 receiver 都具有一个全局唯一的名称,以及对应一个或多个通知方式。当前,Alertmanager 官方内置的第三方通知集成包括邮件、即时通讯软件(如 Slack、Hipchat)、移动应用消息推送(如 Pushover)和自动化运维工具(例如 Pagerduty、Opsgenie、Victorops)。
在 Alertmanager 的管理界面中可以查看到每个 receiver 的配置,以及对应的通知方式和参数。
在配置 receiver 的时候,可以指定 receiver 可以接收哪些标签匹配的告警,并可以指定告警通知的模板。
这样,Alertmanager 可以根据配置将不同的告警通知发送给不同的 receiver,实现高度灵活的告警通知。
目前alertmanager配置
    # 配置告警接收者的信息
    receivers:
    - name: 'default'
      email_configs:
      - to: '877348180@qq.com'
        send_resolved: true  # 接受告警恢复的通知
kind: ConfigMap
metadata:
  name: alertmanager
  namespace: monitor
[root@k8s-master ~/prometheus-all]#cat alertmanager.yml
支持接受者的多种方式
name:receiver的名称,是全局唯一的标识符。email_configs:用于指定通过邮件发送告警通知的配置信息,可以配置多个邮件接收人。hipchat_configs:用于指定通过Hipchat发送告警通知的配置信息,可以配置多个Hipchat账号。slack_configs:用于指定通过Slack发送告警通知的配置信息,可以配置多个Slack账号。opsgenie_configs:用于指定通过Opsgenie发送告警通知的配置信息,可以配置多个Opsgenie账号。webhook_configs:用于指定通过Webhook发送告警通知的配置信息,可以配置多个Webhook地址。
在receiver配置中,可以使用以上的任意一个通知方式,也可以同时使用多个方式。当Alertmanager接收到告警时,会按照receiver配置中的通知方式进行通知,直到其中一个通知方式成功为止。
name: <string>
email_configs:
  [ - <email_config>, ... ]
hipchat_configs:
  [ - <hipchat_config>, ... ]
slack_configs:
  [ - <slack_config>, ... ]
opsgenie_configs:
  [ - <opsgenie_config>, ... ]
webhook_configs:
  [ - <webhook_config>, ... ]

# 上述都是国外的一些通讯软件,国内的支持webhook,如钉钉机器人了
钉钉群聊配置
如果想实现告警消息推送给企业常用的即时聊天工具,如钉钉或者企业微信,如何配置?
Alertmanager的通知方式中还可以支持Webhook,通过这种方式开发者可以实现更多个性化的扩展支持。
# 警报接收者
receivers:
#ops
- name: 'demo-webhook'
  webhook_configs:
  - send_resolved: true
    url: http://demo-webhook/alert/send
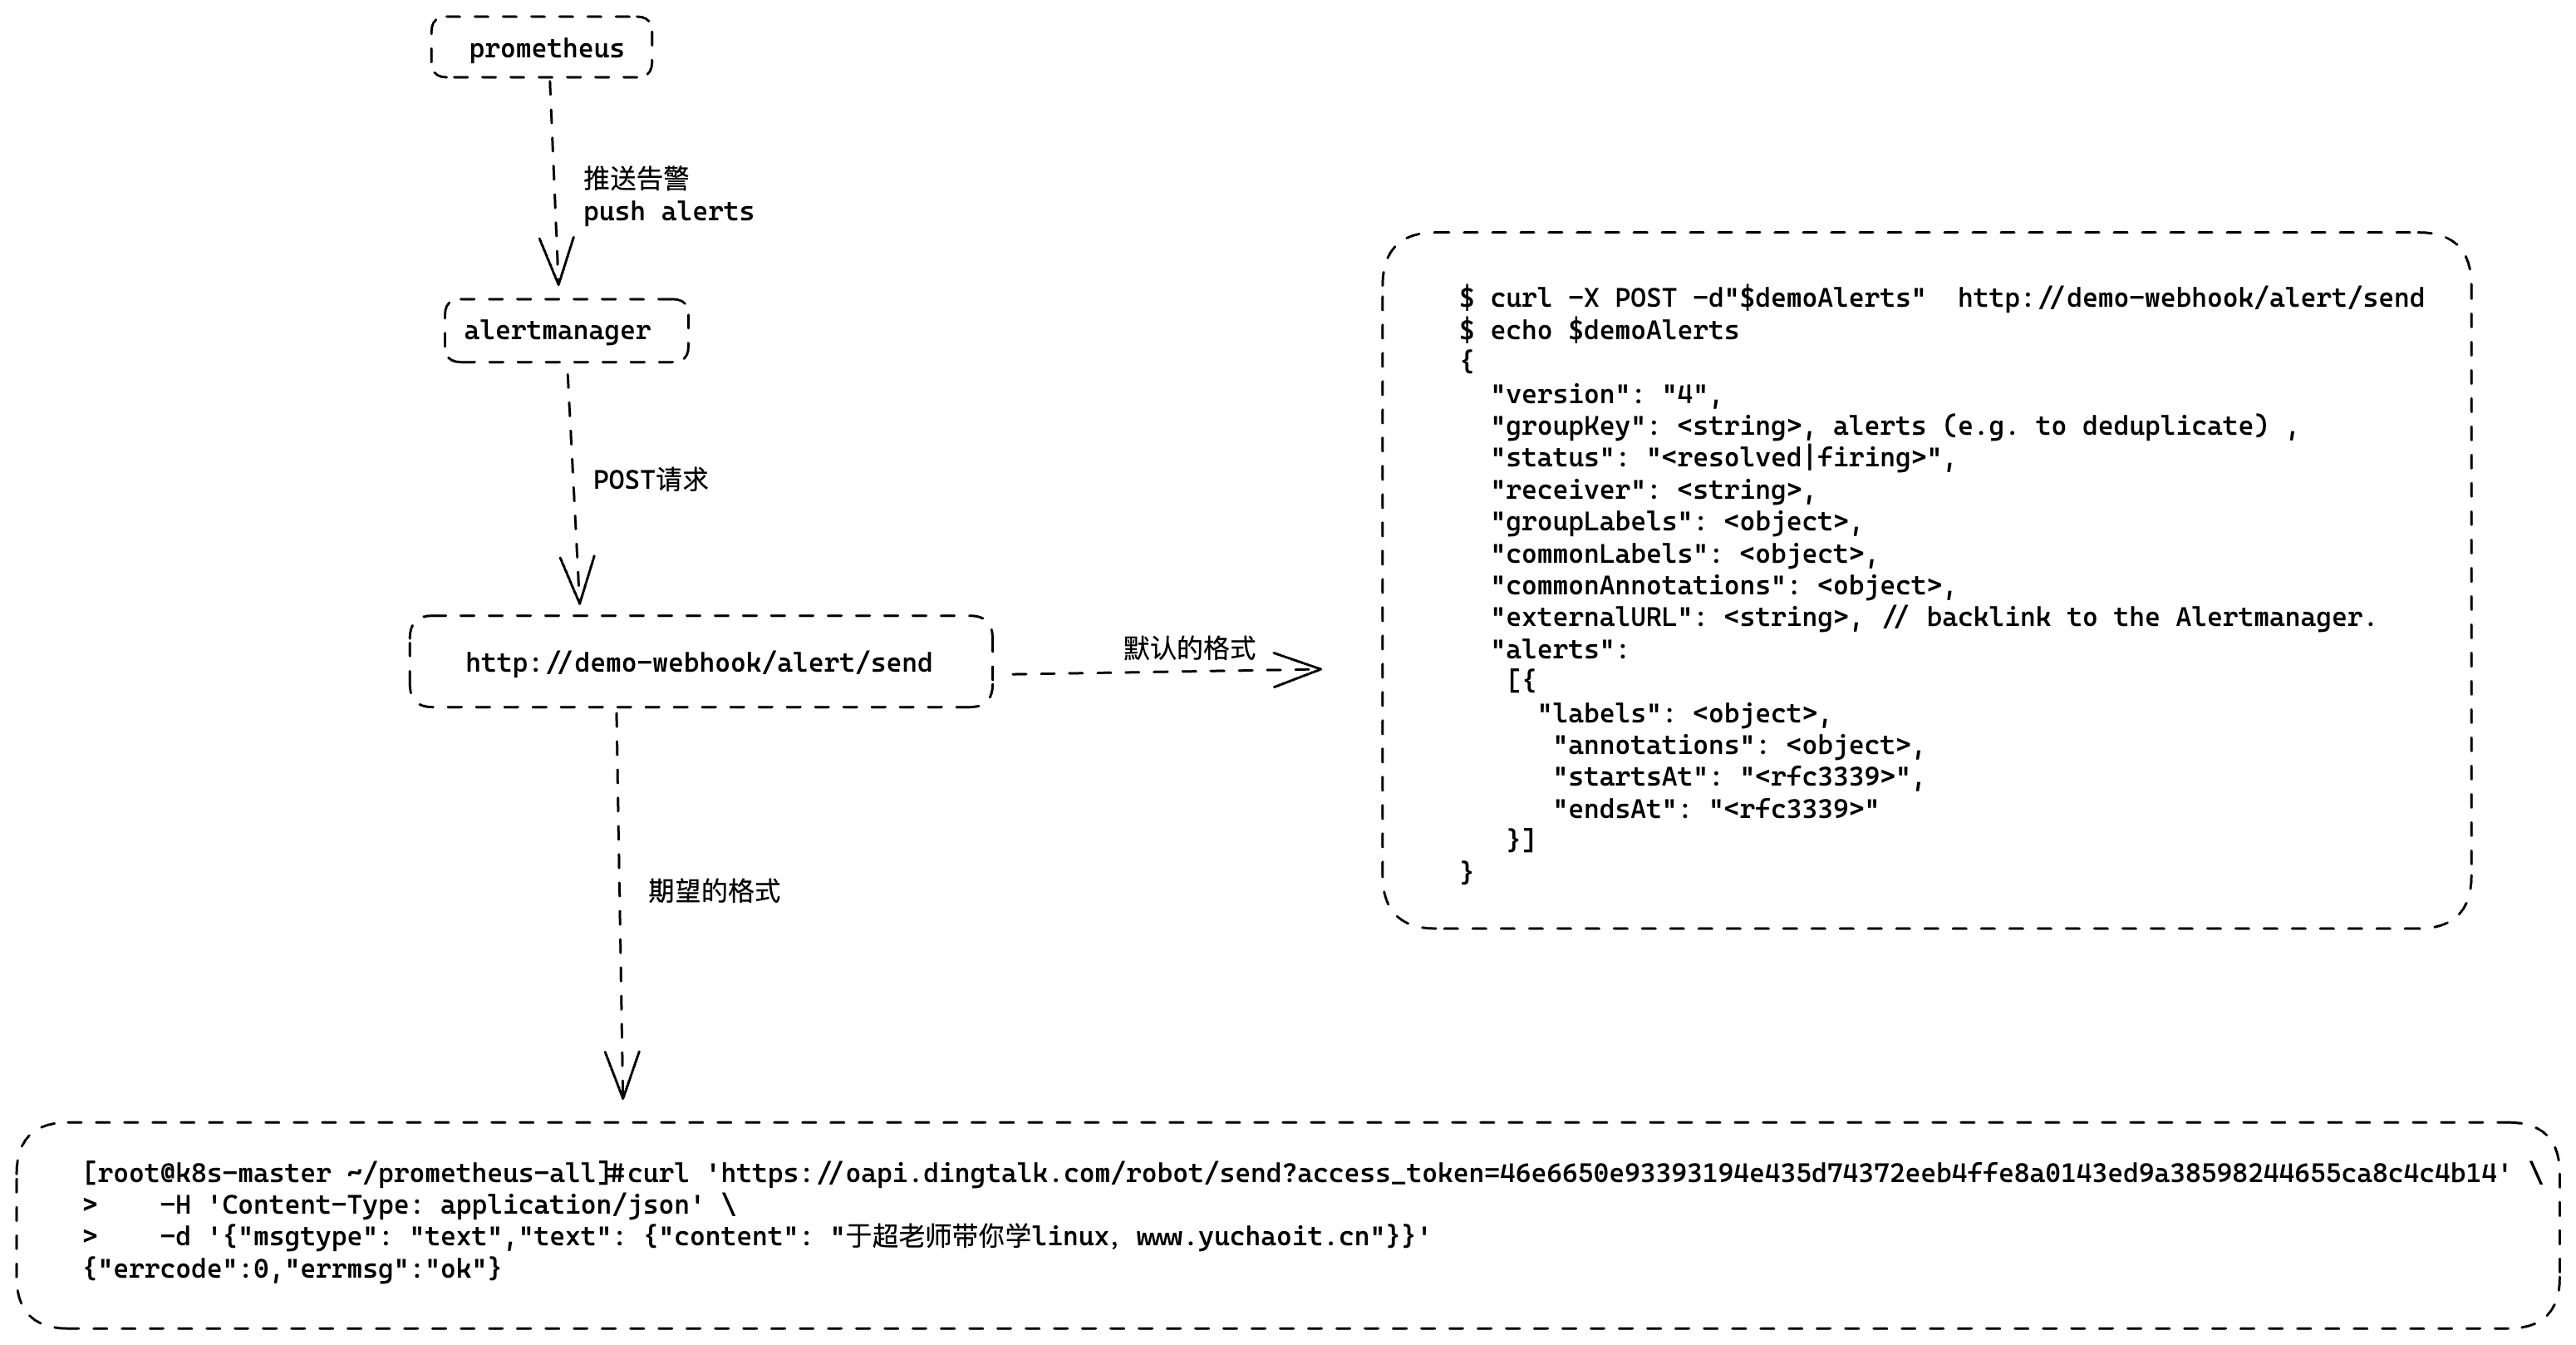
当我们配置了上述webhook地址,则当告警路由到alertmanager时,alertmanager端会向webhook地址推送POST请求:
$ curl -X POST -d"$demoAlerts"  http://demo-webhook/alert/send
$ echo $demoAlerts
{
  "version": "4",
  "groupKey": <string>, alerts (e.g. to deduplicate) ,
  "status": "<resolved|firing>",
  "receiver": <string>,
  "groupLabels": <object>,
  "commonLabels": <object>,
  "commonAnnotations": <object>,
  "externalURL": <string>, // backlink to the Alertmanager.
  "alerts":
   [{
     "labels": <object>,
      "annotations": <object>,
      "startsAt": "<rfc3339>",
      "endsAt": "<rfc3339>"
   }]
}
因此,假如我们想把报警消息自动推送到钉钉群聊,只需要:
- 实现一个webhook,部署到k8s集群
- 接收POST请求,将Alertmanager传过来的数据做解析,调用dingtalk的API,实现消息推送
- 配置alertmanager的receiver为webhook地址
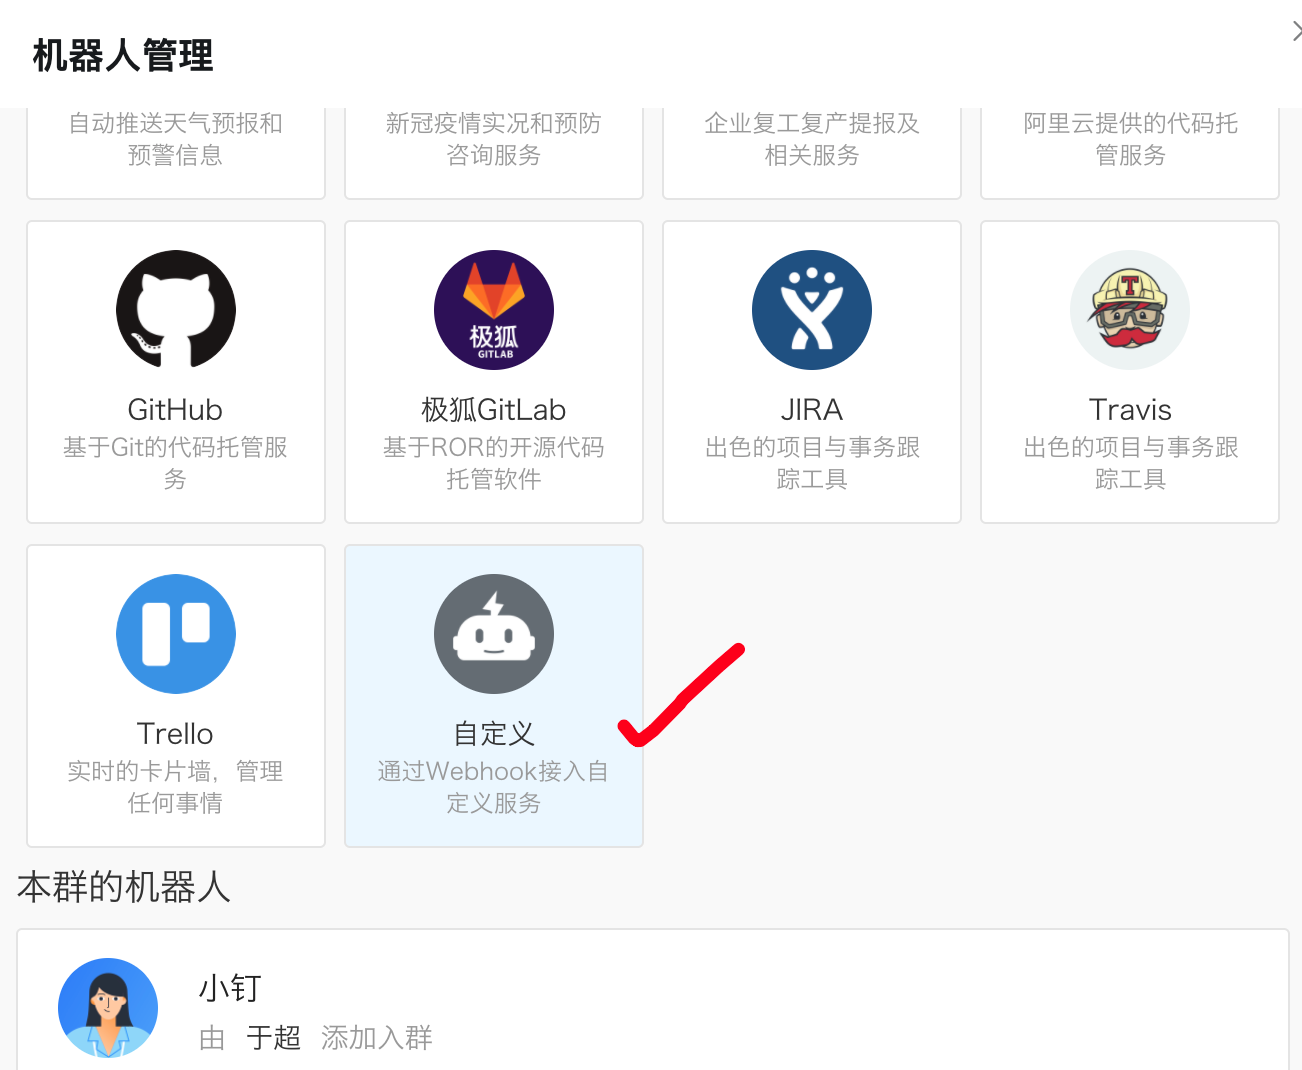
钉钉机器人创建
如何给钉钉群聊发送消息? 钉钉机器人
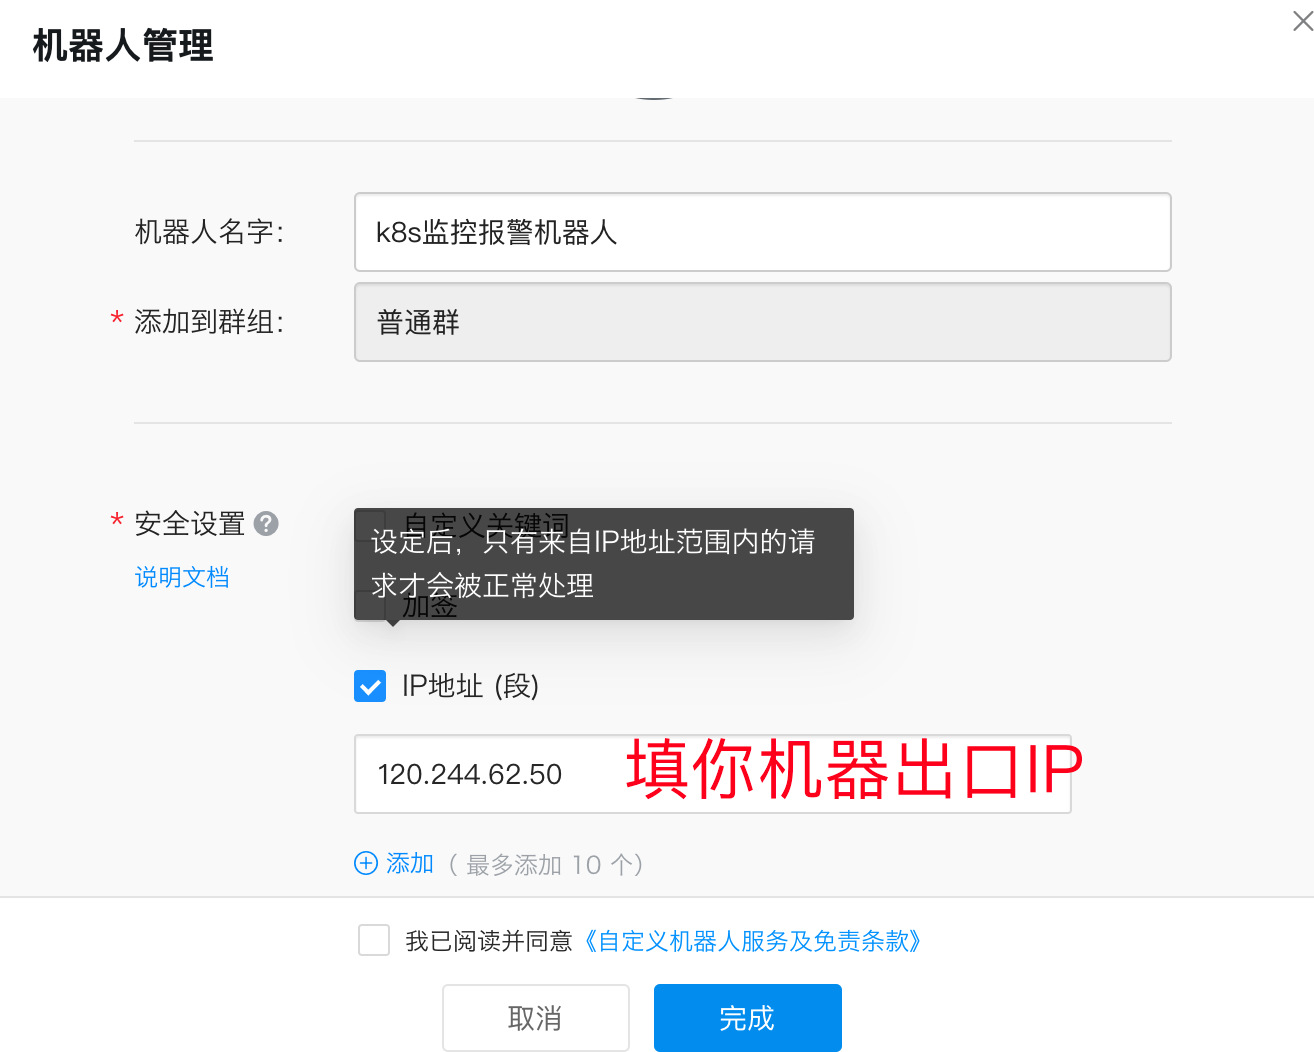
钉钉群聊机器人设置:
每个群聊机器人在创建的时候都会生成唯一的一个访问地址:
https://oapi.dingtalk.com/robot/send?access_token=46e6650e93393194e435d74372eeb4ffe8a0143ed9a38598244655ca8c4c4b14
拿到一个唯一的API
访问试试
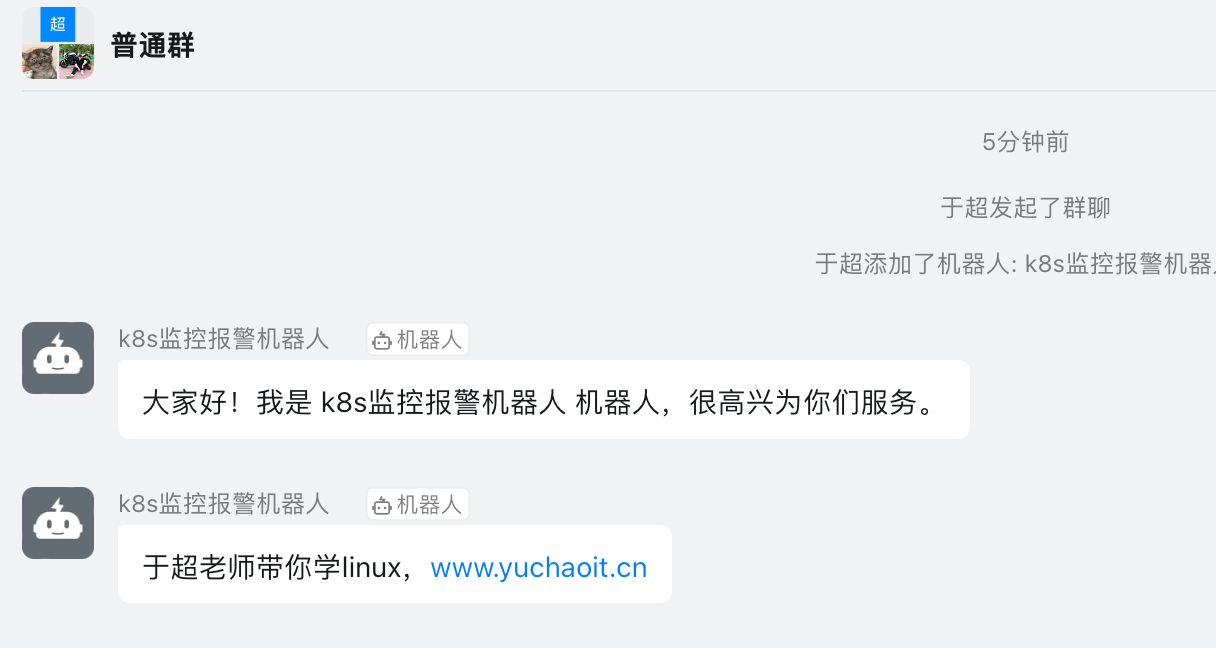
[root@k8s-master ~/prometheus-all]#curl 'https://oapi.dingtalk.com/robot/send?access_token=46e6650e93393194e435d74372eeb4ffe8a0143ed9a38598244655ca8c4c4b14' \
> -H 'Content-Type: application/json' \
> -d '{"msgtype": "text","text": {"content": "于超老师带你学linux,www.yuchaoit.cn"}}'
{"errcode":0,"errmsg":"ok"}
问题:
但是alertmanager系统配置的webhook发送的JSON格式,是和钉钉API的字段不符的,没法直接用
钉钉机器人API访问要求文档
https://open.dingtalk.com/document/robots/custom-robot-access
需要转换数据格式
安装prometheus-webhook-dingtalk插件
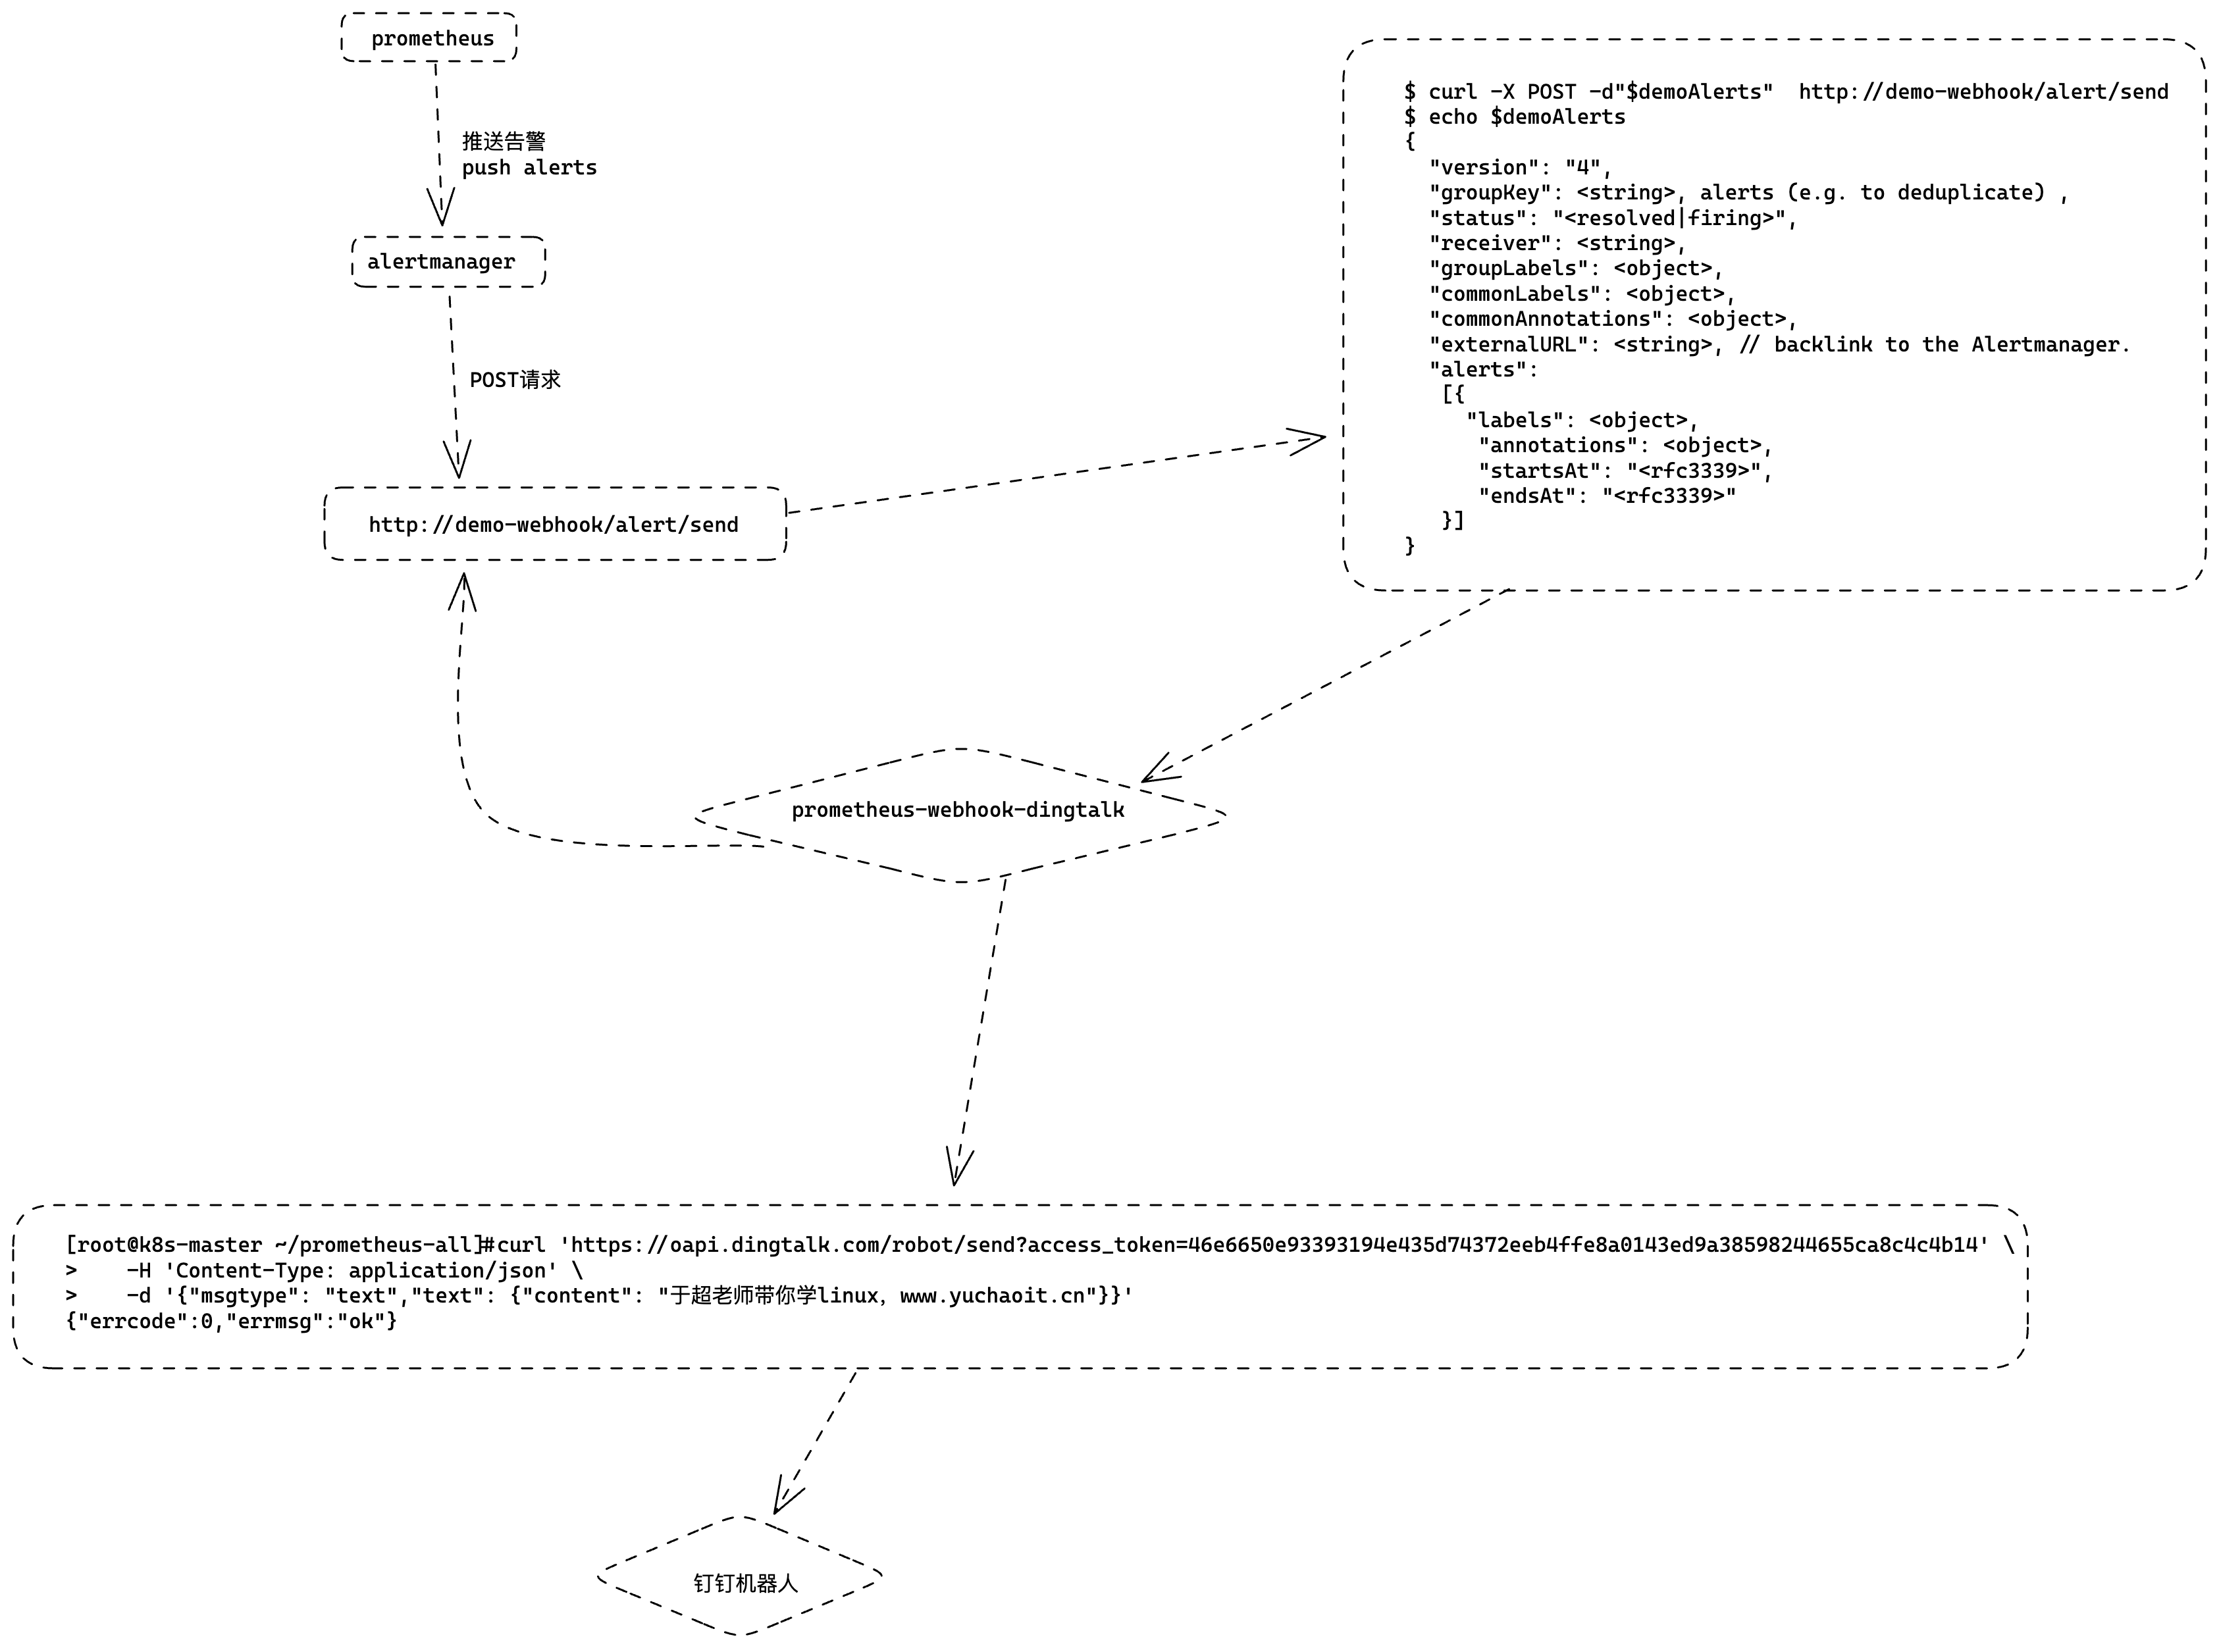
prometheus-webhook-dingtalk 是一个第三方的告警通知插件,用于将 Prometheus 的告警信息发送到钉钉群组。
安装 prometheus-webhook-dingtalk 需要以下步骤:
- 下载安装二进制文件或者使用源代码编译安装。
- 配置
prometheus-webhook-dingtalk的钉钉机器人 Webhook 地址和关键字等参数。 - 配置 Alertmanager 发送告警信息到
prometheus-webhook-dingtalk插件。 - 重启
prometheus-webhook-dingtalk和 Alertmanager 以使配置生效。
# 安装
镜像地址:timonwong/prometheus-webhook-dingtalk:master

# 运行方式
$ ./prometheus-webhook-dingtalk --config.file=config.yml

# 配置文件示例
targets:
  webhook_dev:
    url: https://oapi.dingtalk.com/robot/send?access_token=f33c539fa1012e0b3500f04ea98fb89468829ed324699d67ecd2f177a1dcc0c2
  webhook_ops:
    url: https://oapi.dingtalk.com/robot/send?access_token=4778abd23dbdbaf66fc6f413e6ab9c0103a039b0054201344a22a5692cdcc54e

# 则prometheus-webhook-dingtalk启动后会自动支持如下API的POST访问:
http://locahost:8060/dingtalk/webhook_dev/send
http://localhost:8060/dingtalk/webhook_ops/send

这样可以使用一个prometheus-webhook-dingtalk来实现多个钉钉群的webhook地址
部署流程
部署prometheus-webhook-dingtalk,从Dockerfile可以得知需要注意的点:
- 默认使用配置文件
/etc/prometheus-webhook-dingtalk/config.yml,可以通过configmap挂载 - 该目录下还有模板文件,因此需要使用subpath的方式挂载
- 部署Service,作为Alertmanager的默认访问,服务端口默认8060
[root@k8s-master ~/prometheus-all]#cat webhook-dingtalk.yml
apiVersion: v1
data:
  config.yml: |
    targets:
      webhook_ops:
        url: https://oapi.dingtalk.com/robot/send?access_token=46e6650e93393194e435d74372eeb4ffe8a0143ed9a38598244655ca8c4c4b14
kind: ConfigMap
metadata:
  name: webhook-dingtalk-config
  namespace: monitor
[root@k8s-master ~/prometheus-all]#

# 创建configmap
[root@k8s-master ~/prometheus-all]#kubectl apply -f webhook-dingtalk.yml
configmap/webhook-dingtalk-config created
创建后端
$ cat webhook-dingtalk-deploy.yaml
apiVersion: apps/v1
kind: Deployment
metadata:
  name: webhook-dingtalk
  namespace: monitor
spec:
  selector:
    matchLabels:
      app: webhook-dingtalk
  template:
    metadata:
      labels:
        app: webhook-dingtalk
    spec:
      containers:
      - name: webhook-dingtalk
        image: timonwong/prometheus-webhook-dingtalk:master
        args:
        - "--config.file=/etc/prometheus-webhook-dingtalk/config.yml"
        imagePullPolicy: IfNotPresent
        volumeMounts:
        - mountPath: "/etc/prometheus-webhook-dingtalk/config.yml"
          name: config
          subPath: config.yml
        ports:
        - containerPort: 8060
          name: http
        resources:
          requests:
            cpu: 50m
            memory: 100Mi
          limits:
            cpu: 50m
            memory: 100Mi
      volumes:
      - name: config
        configMap:
          name: webhook-dingtalk-config
          items:
          - key: config.yml
            path: config.yml
---
apiVersion: v1
kind: Service
metadata:
  name: webhook-dingtalk
  namespace: monitor
spec:
  selector:
    app: webhook-dingtalk
  ports:
  - name: hook
    port: 8060
    targetPort: http
创建查看
[root@k8s-master ~/prometheus-all]#kubectl create -f webhook-all.yml
deployment.apps/webhook-dingtalk created
service/webhook-dingtalk created


[root@k8s-master ~/prometheus-all]#
[root@k8s-master ~/prometheus-all]#kubectl -n monitor get po
NAME                                 READY   STATUS    RESTARTS        AGE
alertmanager-6d6dd4bcc5-fbssh        1/1     Running   0               3h19m
grafana-5588cfdb99-94chv             1/1     Running   1 (3h46m ago)   22h
kube-state-metrics-7dc6bc9d6-bpscm   1/1     Running   1 (3h46m ago)   27h
node-exporter-68n2w                  1/1     Running   1 (3h46m ago)   6d21h
node-exporter-6z9sj                  1/1     Running   1 (3h46m ago)   6d21h
node-exporter-rkrgh                  1/1     Running   1 (3h46m ago)   6d21h
prometheus-6c8768547-v7hqq           1/1     Running   1 (3h46m ago)   7d
webhook-dingtalk-d4fd79f76-ldj8b     1/1     Running   0               13s
看看日志
[root@k8s-master ~/prometheus-all]#kubectl -n monitor logs webhook-dingtalk-d4fd79f76-ldj8b
level=info ts=2023-05-05T07:20:19.400Z caller=main.go:60 msg="Starting prometheus-webhook-dingtalk" version="(version=2.0.0, branch=master, revision=4e77a3cc3e7a23fcb18b33826bce8d2904583465)"
level=info ts=2023-05-05T07:20:19.400Z caller=main.go:61 msg="Build context" (gogo1.16.7,userroot@337ecc9a2774,date20210819-13:17:15)=(MISSING)
level=info ts=2023-05-05T07:20:19.400Z caller=coordinator.go:83 component=configuration file=/etc/prometheus-webhook-dingtalk/config.yml msg="Loading configuration file"
level=info ts=2023-05-05T07:20:19.401Z caller=coordinator.go:91 component=configuration file=/etc/prometheus-webhook-dingtalk/config.yml msg="Completed loading of configuration file"
level=info ts=2023-05-05T07:20:19.401Z caller=main.go:98 component=configuration msg="Loading templates" templates=
ts=2023-05-05T07:20:19.401Z caller=main.go:114 component=configuration msg="Webhook urls for prometheus alertmanager" urls=http://localhost:8060/dingtalk/webhook_ops/send
level=info ts=2023-05-05T07:20:19.496Z caller=web.go:210 component=web msg="Start listening for connections" address=:8060
[root@k8s-master ~/prometheus-all]#
根据日志可以看出,prometheus-webhook-dingtalk已经成功启动,并且已经加载了配置文件/etc/prometheus-webhook-dingtalk/config.yml,同时也加载了模板。
另外,也可以看到它监听的端口是8060,可以通过地址http://localhost:8060/dingtalk/webhook_ops/send来接收来自Alertmanager的告警信息。
修改alertmanager配置文件
# 填入alertmanager,关于webhook插件的API地址即可,注意些service的名字即可
[root@k8s-master ~/prometheus-all]#kubectl -n monitor exec alertmanager-6d6dd4bcc5-fbssh -- cat /etc/alertmanager/config.yml > /tmp/config.yml

[root@k8s-master ~/prometheus-all]#vim /tmp/config.yml


# 配置告警接收者的信息
receivers:
- name: 'default'
  email_configs:
  - to: '877348180@qq.com'
    send_resolved: true  # 接受告警恢复的通知
  webhook_configs:
  - send_resolved: true # 注意填写,service服务发现地址
    url: http://webhook-dingtalk:8060/dingtalk/webhook_ops/send

# 重载alertmanager配置
[root@k8s-master ~/prometheus-all]#kubectl -n monitor delete cm alertmanager
configmap "alertmanager" deleted

[root@k8s-master ~/prometheus-all]#kubectl -n monitor create configmap alertmanager --from-file=/tmp/config.yml
configmap/alertmanager created

# 重载alertmanager配置
[root@k8s-master ~/prometheus-all]#curl -X POST  10.106.2.206:9093/-/reload
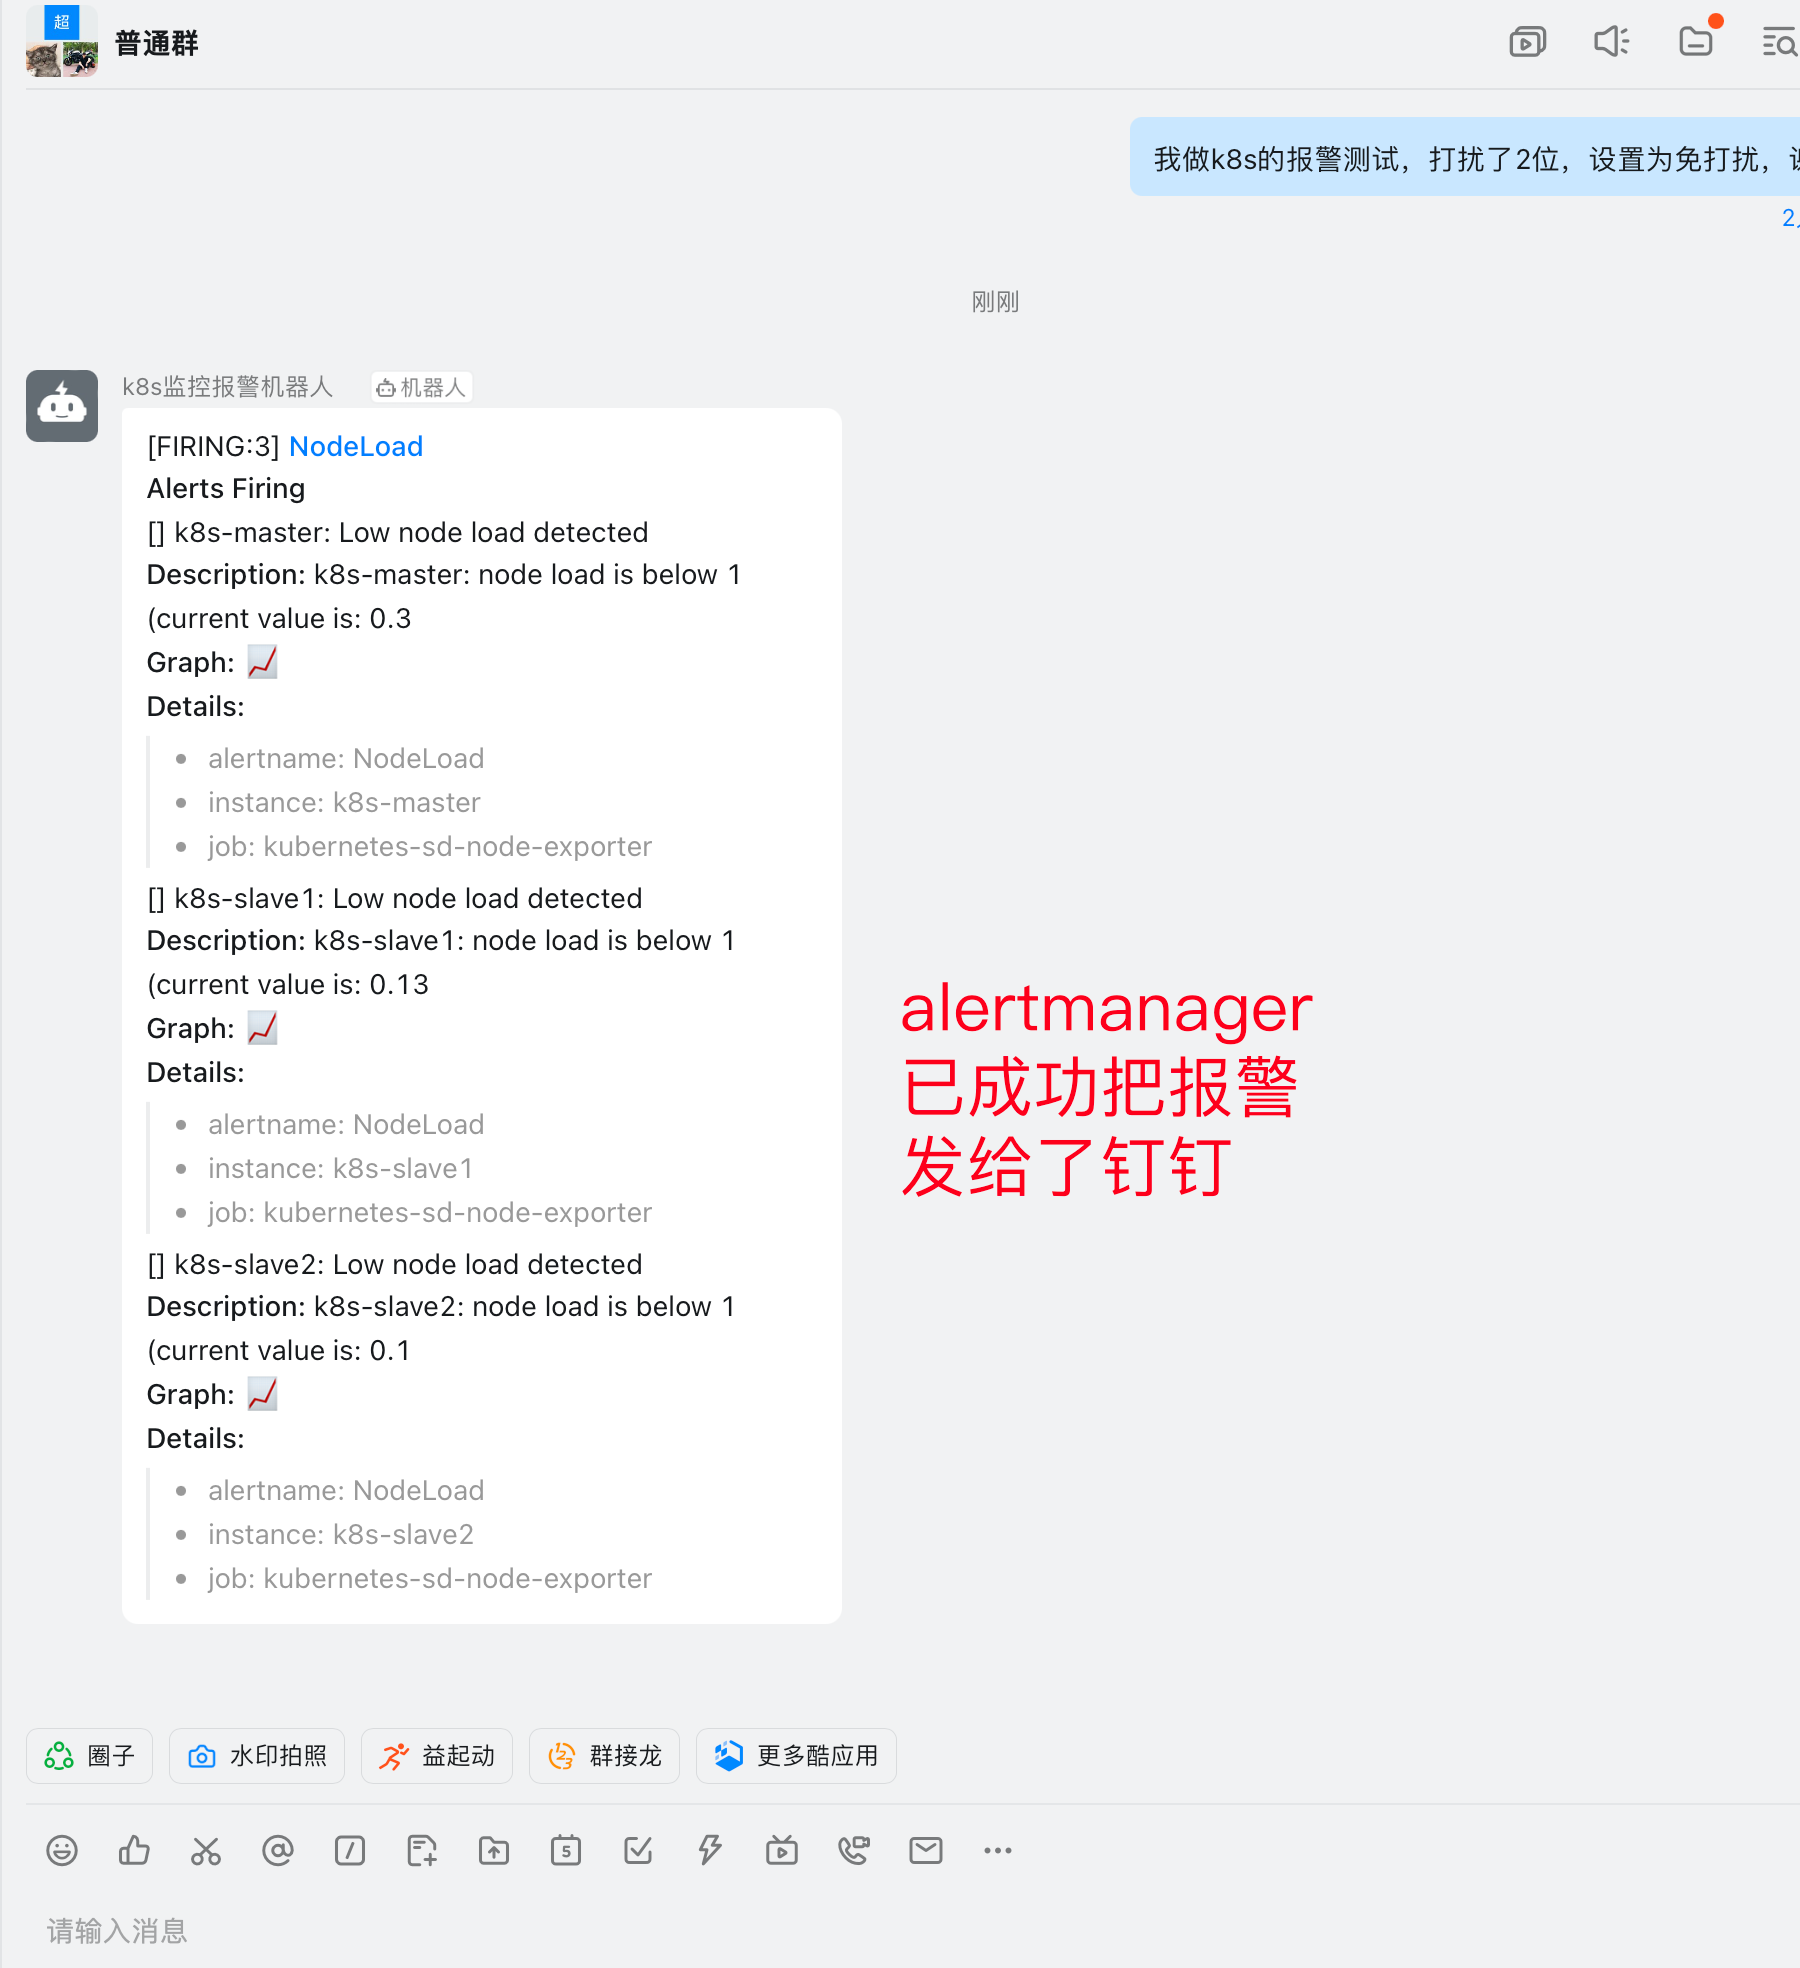
钉钉收到报警
取消报警
调整策略,或者删除配置都行
[root@k8s-master ~/prometheus-all]#kubectl -n monitor get configmaps prometheus-config  -oyaml |grep node_load
        expr: node_load15 > 1

[root@k8s-master ~/prometheus-all]#curl -X POST 10.109.81.166:9090/-/reload
